
- Home >
- Stock Photos >
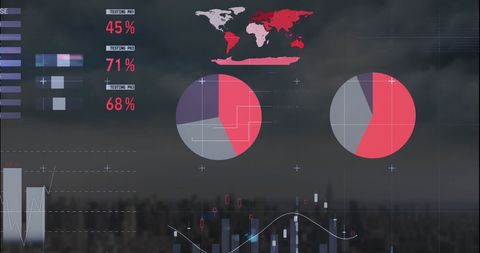
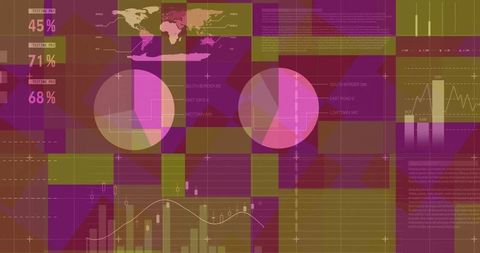
- Big Data Analytics with Futuristic Interface and Graphs
Big Data Analytics with Futuristic Interface and Graphs Image

Visualizes the concept of big data analytics featuring futuristic interface and graphs, ideal for technology, business, and data analysis-related content. The use of maps and pie charts suggests global business operations and productivity trends.
Powered by 


downloads
Tags:
More
Credit Photo
If you would like to credit the Photo, here are some ways you can do so
Text Link
photo Link
<span class="text-link">
<span>
<a target="_blank" href=https://pikwizard.com/photo/big-data-analytics-with-futuristic-interface-and-graphs/ea299b94a2e4fa633a9a43627def8f3f/>PikWizard</a>
</span>
</span>
<span class="image-link">
<span
style="margin: 0 0 20px 0; display: inline-block; vertical-align: middle; width: 100%;"
>
<a
target="_blank"
href="https://pikwizard.com/photo/big-data-analytics-with-futuristic-interface-and-graphs/ea299b94a2e4fa633a9a43627def8f3f/"
style="text-decoration: none; font-size: 10px; margin: 0;"
>
<img src="https://pikwizard.com/pw/medium/ea299b94a2e4fa633a9a43627def8f3f.jpg" style="margin: 0; width: 100%;" alt="" />
<p style="font-size: 12px; margin: 0;">PikWizard</p>
</a>
</span>
</span>
Free (free of charge)
Free for personal and commercial use.
Author: Authentic Images
Similar Free Stock Images

Premium


Premium

Premium


Premium


Premium


Premium


Premium


Premium

Premium


Premium


Premium

Premium

Premium

Premium


Premium


Premium

Premium


Premium


Premium


Premium


Premium


Premium


Premium


Premium


Premium

Explore More Free Stock Images