
- Home >
- Stock Photos >
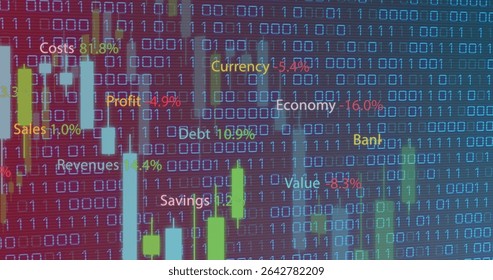
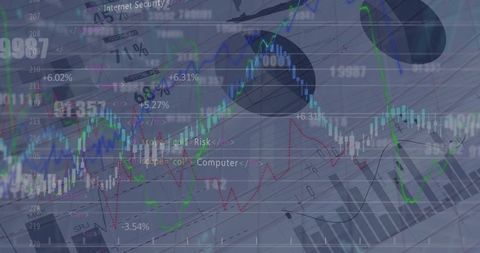
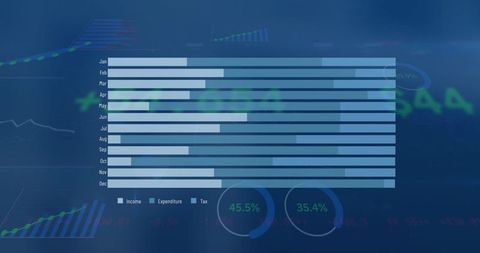
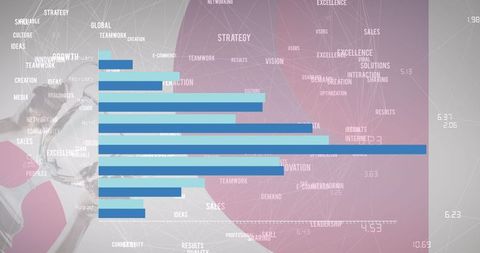
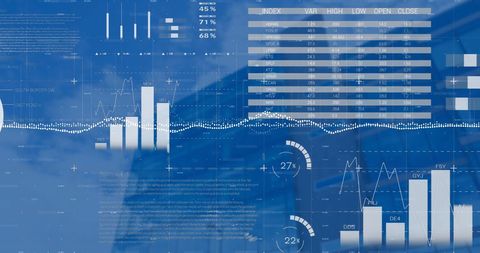
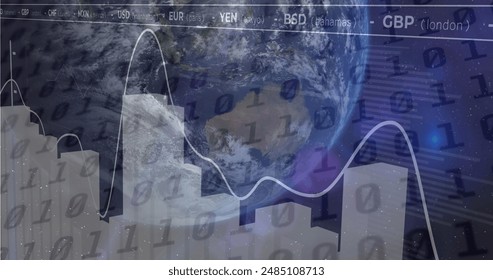
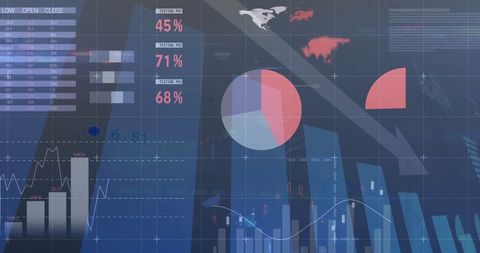
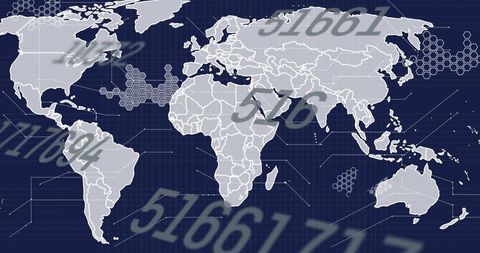
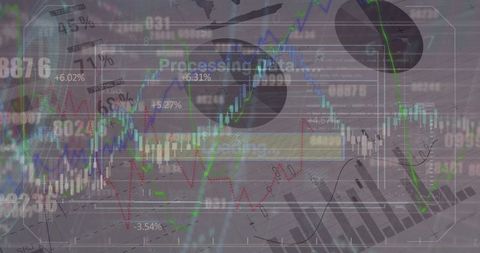
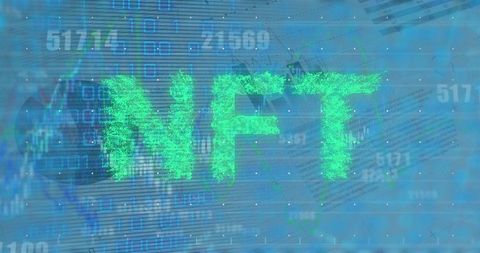
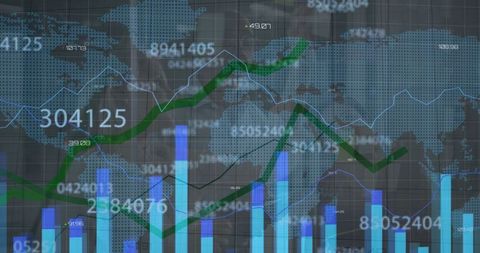
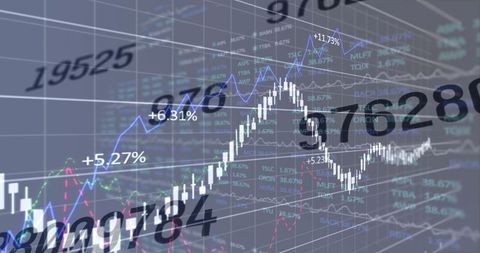
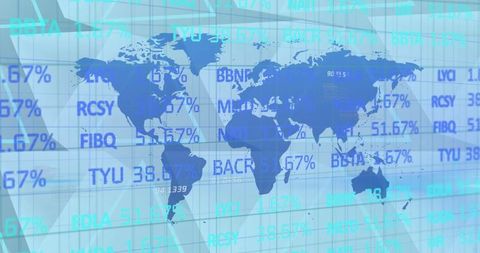
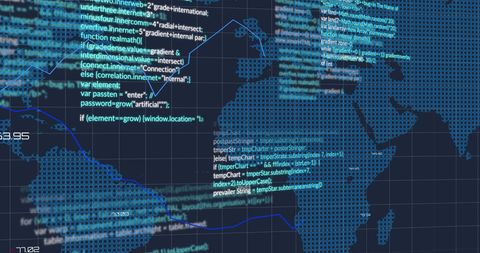
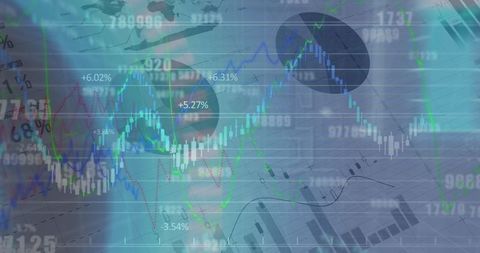
- Binary Code Blended with Financial Data and Graph Illustrations
Binary Code Blended with Financial Data and Graph Illustrations Image

Visual representation blending binary code and financial data charts offers insights into the global economy. Ideal for illustrating articles on digital finance and technical analysis, usage in financial tech marketing, and educational content in data analytics. Highlights the connection between technology, data understanding, and financial trends.
Powered by  - Get 15% off with code: PIKWIZARD15


downloads
Tags:
More
Credit Photo
If you would like to credit the Photo, here are some ways you can do so
Text Link
photo Link
<span class="text-link">
<span>
<a target="_blank" href=https://pikwizard.com/photo/binary-code-blended-with-financial-data-and-graph-illustrations/5e80a11104407406e10db401fc05c5f4/>PikWizard</a>
</span>
</span>
<span class="image-link">
<span
style="margin: 0 0 20px 0; display: inline-block; vertical-align: middle; width: 100%;"
>
<a
target="_blank"
href="https://pikwizard.com/photo/binary-code-blended-with-financial-data-and-graph-illustrations/5e80a11104407406e10db401fc05c5f4/"
style="text-decoration: none; font-size: 10px; margin: 0;"
>
<img src="https://pikwizard.com/pw/medium/5e80a11104407406e10db401fc05c5f4.jpg" style="margin: 0; width: 100%;" alt="" />
<p style="font-size: 12px; margin: 0;">PikWizard</p>
</a>
</span>
</span>
Free (free of charge)
Free for personal and commercial use.
Author: People Creations
Similar Free Stock Images

Premium


Premium


Premium


Premium


Premium


Premium

Premium


Premium


Premium


Premium


Premium


Premium


Premium
Premium


Premium


Premium


Premium


Premium


Premium


Premium


Premium


Premium

Premium


Premium


Premium


Explore More Free Stock Images