
- Home >
- Stock Photos >
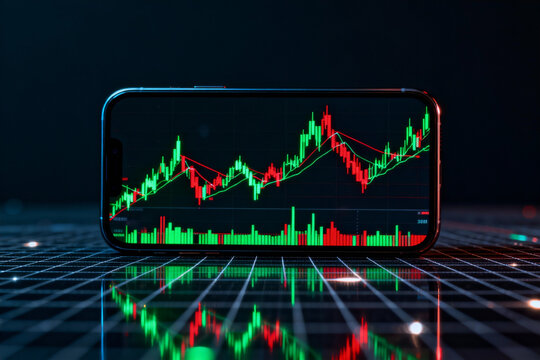
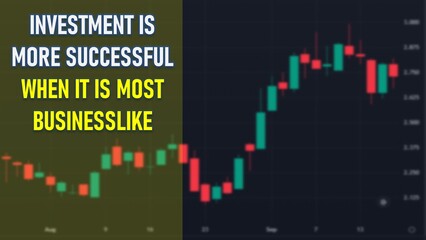
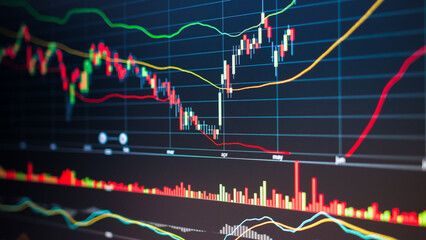
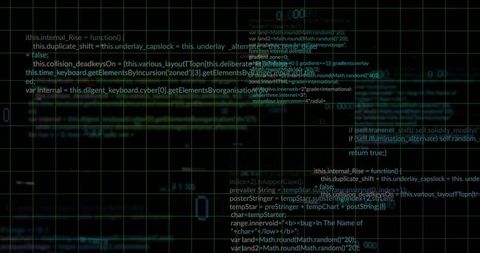
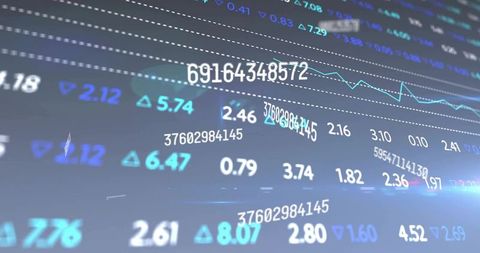
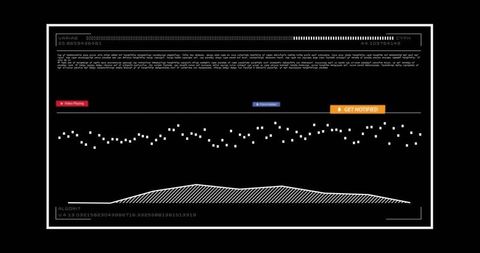
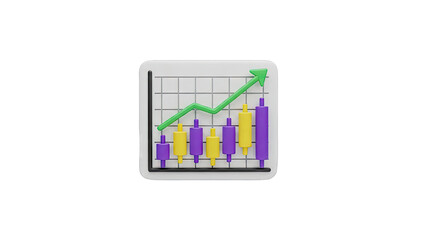
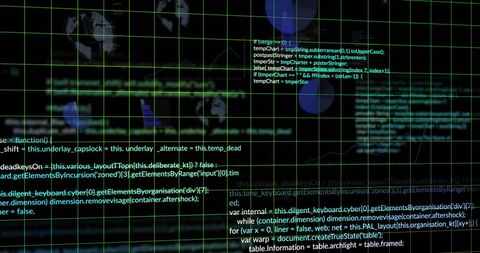
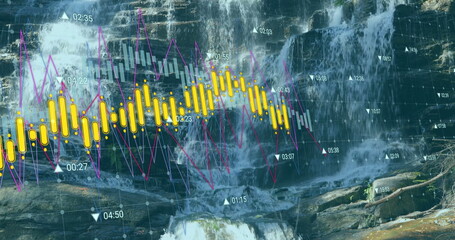
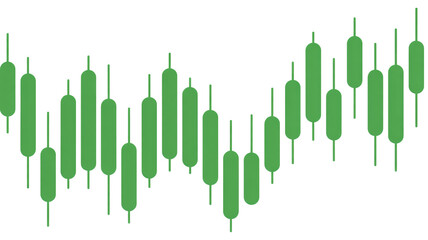
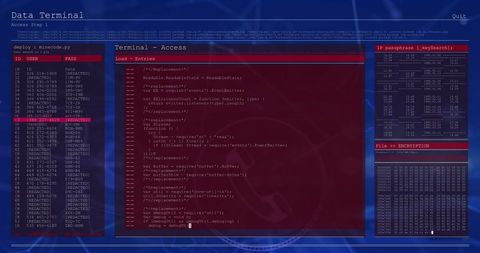
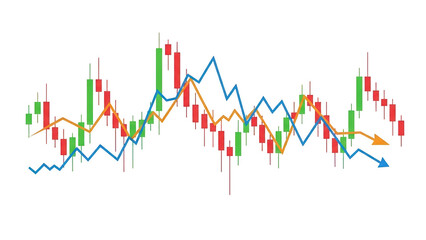
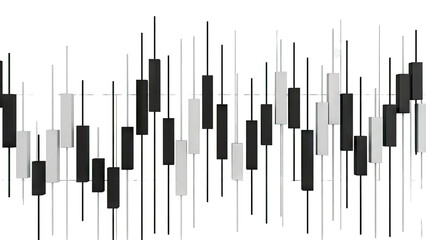
- Binary Code Streaming Over Bullish Stock Market Candlestick Chart
Binary Code Streaming Over Bullish Stock Market Candlestick Chart Image

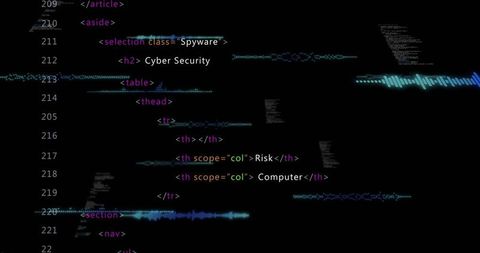
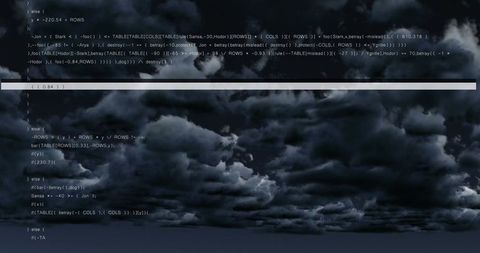
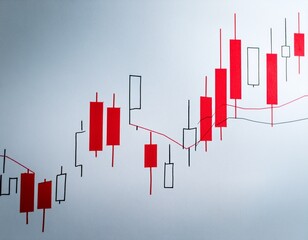
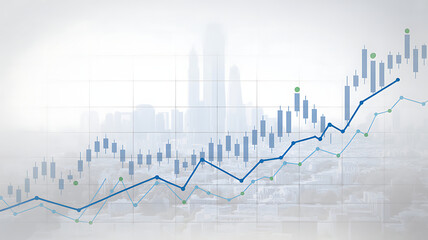
Displaying interplay of binary code stream and rising stock market trend with candlestick chart, symbolizes blend of traditional investment techniques with modern technology. Ideal for financial analysis platforms, digital investment articles, stock trading websites looking to emphasize blend of data analysis and financial growth.
Powered by 


downloads
Tags:
More
Credit Photo
If you would like to credit the Photo, here are some ways you can do so
Text Link
photo Link
<span class="text-link">
<span>
<a target="_blank" href=https://pikwizard.com/photo/binary-code-streaming-over-bullish-stock-market-candlestick-chart/8d25e9ee20f7b85bc19aaaca4585ea49/>PikWizard</a>
</span>
</span>
<span class="image-link">
<span
style="margin: 0 0 20px 0; display: inline-block; vertical-align: middle; width: 100%;"
>
<a
target="_blank"
href="https://pikwizard.com/photo/binary-code-streaming-over-bullish-stock-market-candlestick-chart/8d25e9ee20f7b85bc19aaaca4585ea49/"
style="text-decoration: none; font-size: 10px; margin: 0;"
>
<img src="https://pikwizard.com/pw/medium/8d25e9ee20f7b85bc19aaaca4585ea49.jpg" style="margin: 0; width: 100%;" alt="" />
<p style="font-size: 12px; margin: 0;">PikWizard</p>
</a>
</span>
</span>
Free (free of charge)
Free for personal and commercial use.
Author: Awesome Content
Similar Free Stock Images

Premium


Premium

Premium


Premium
Premium


Premium


Premium

Premium


Premium


Premium
Premium


Premium


Premium


Premium


Premium


Premium

Premium


Premium


Premium

Premium


Premium


Premium


Premium


Premium


Premium
Explore More Free Stock Images