- Home >
- Stock Photos >
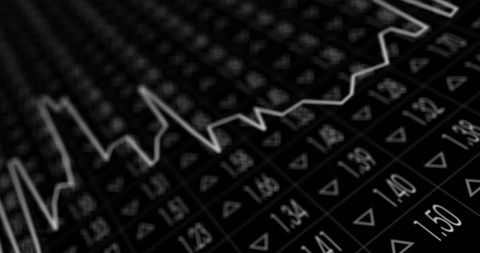
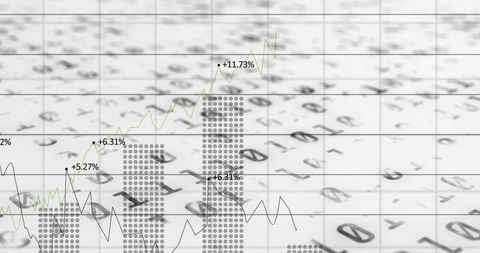
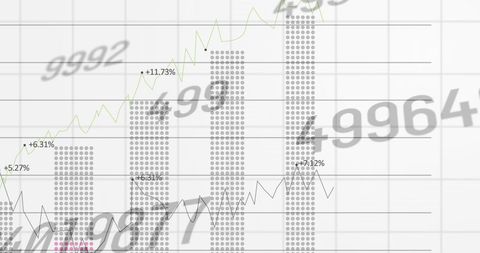
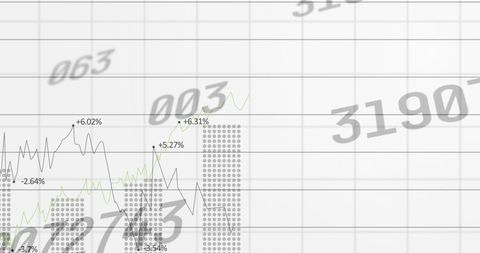
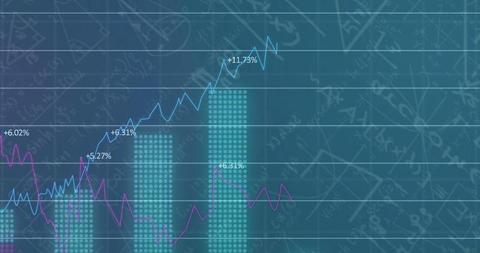
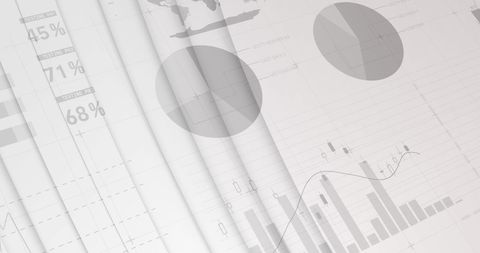
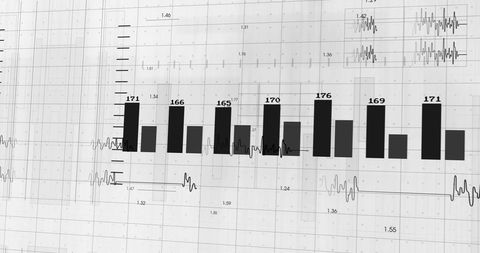
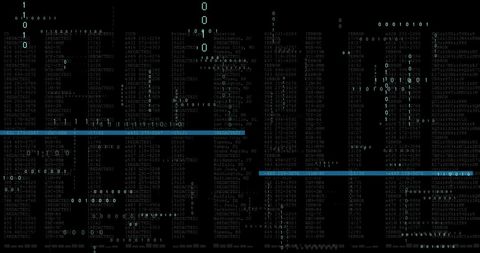
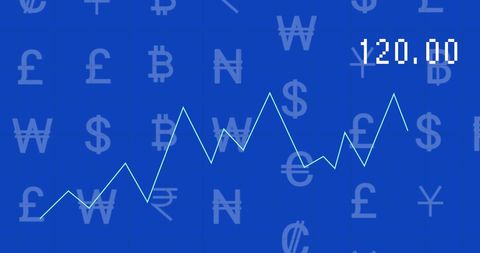
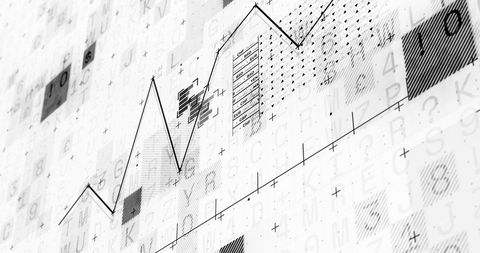
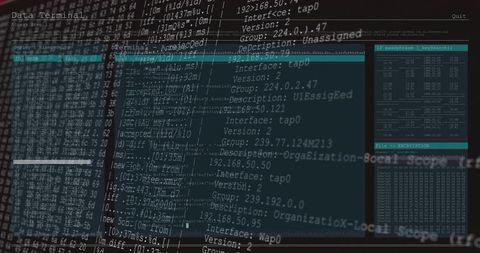
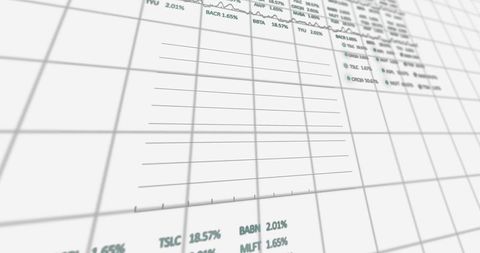
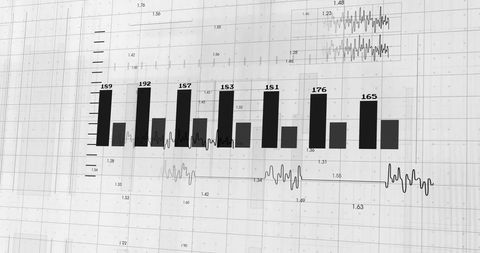
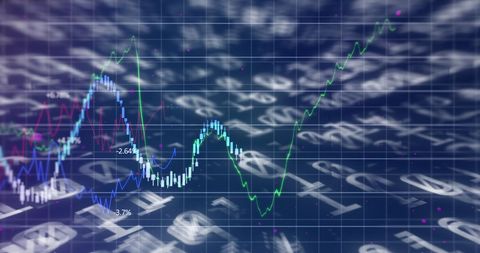
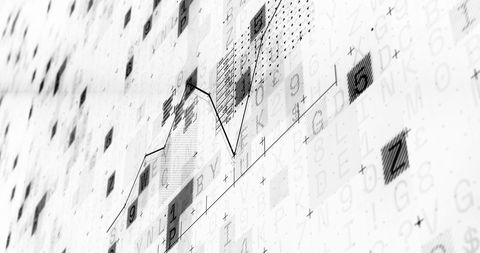
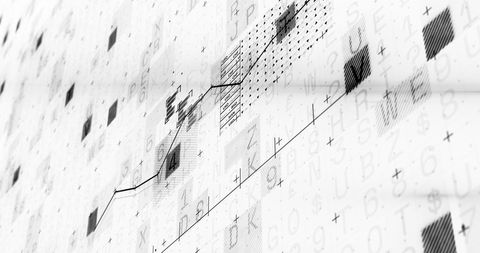
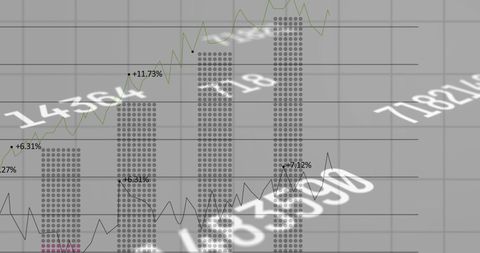
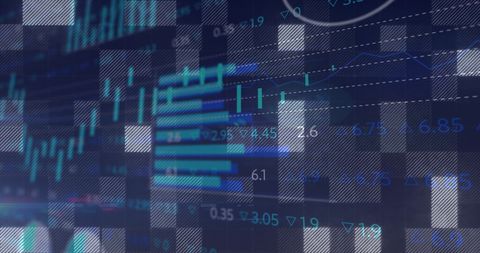
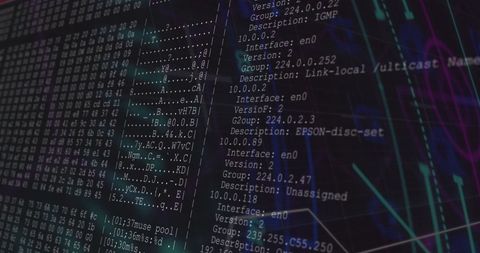
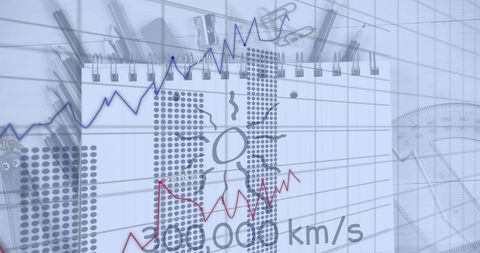
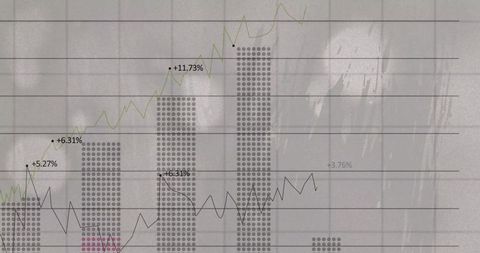
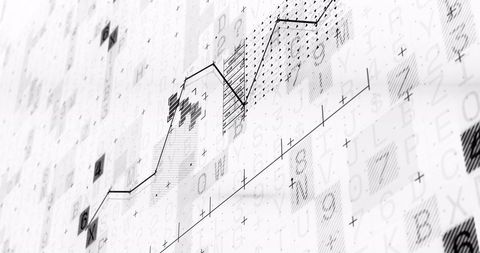
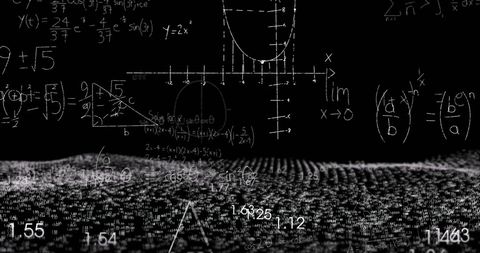
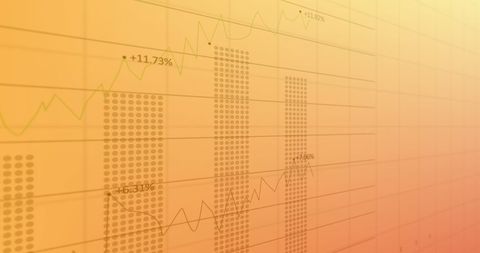
- Binary Code with Financial Charts and Data Analysis
Binary Code with Financial Charts and Data Analysis Image
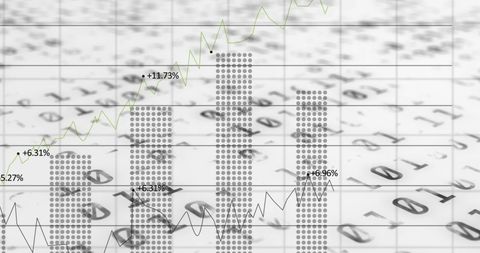
Shows overlay of binary code and financial bar charts, symbolizing data processing and digital financial analysis. Ideal for illustrating financial technology growth, data analytics in business, or digital transformation themes. Useful in tech presentations, financial reports, or business strategy documentation.

downloads
Tags:
More
Credit Photo
If you would like to credit the Photo, here are some ways you can do so
Text Link
photo Link
<span class="text-link">
<span>
<a target="_blank" href=https://pikwizard.com/photo/binary-code-with-financial-charts-and-data-analysis/fc04ce11a243846074f6924aa7620720/>PikWizard</a>
</span>
</span>
<span class="image-link">
<span
style="margin: 0 0 20px 0; display: inline-block; vertical-align: middle; width: 100%;"
>
<a
target="_blank"
href="https://pikwizard.com/photo/binary-code-with-financial-charts-and-data-analysis/fc04ce11a243846074f6924aa7620720/"
style="text-decoration: none; font-size: 10px; margin: 0;"
>
<img src="https://pikwizard.com/pw/medium/fc04ce11a243846074f6924aa7620720.jpg" style="margin: 0; width: 100%;" alt="" />
<p style="font-size: 12px; margin: 0;">PikWizard</p>
</a>
</span>
</span>
Free (free of charge)
Free for personal and commercial use.
Author: People Creations