- Home >
- Stock Photos >
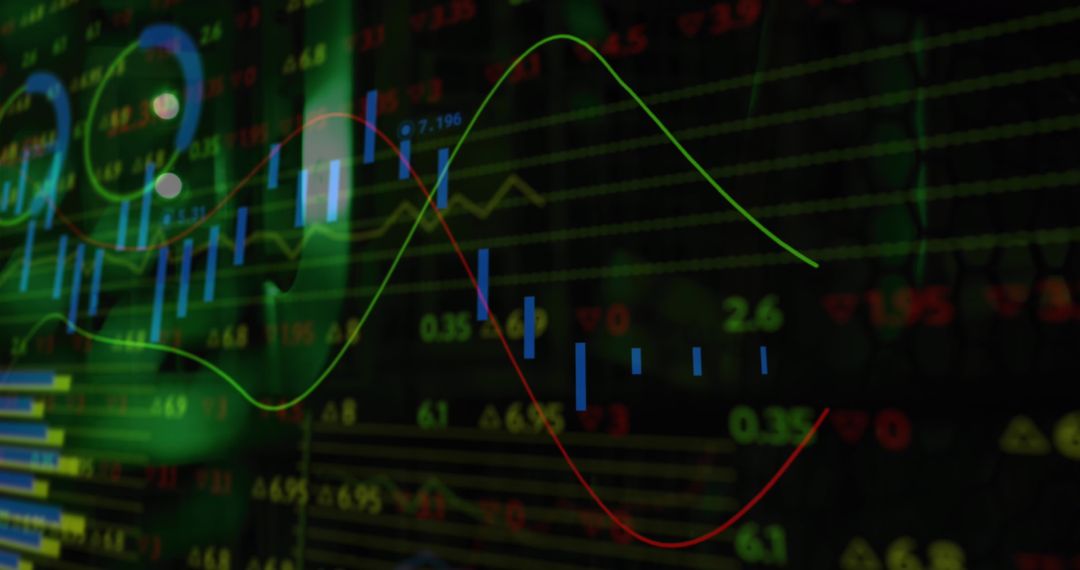
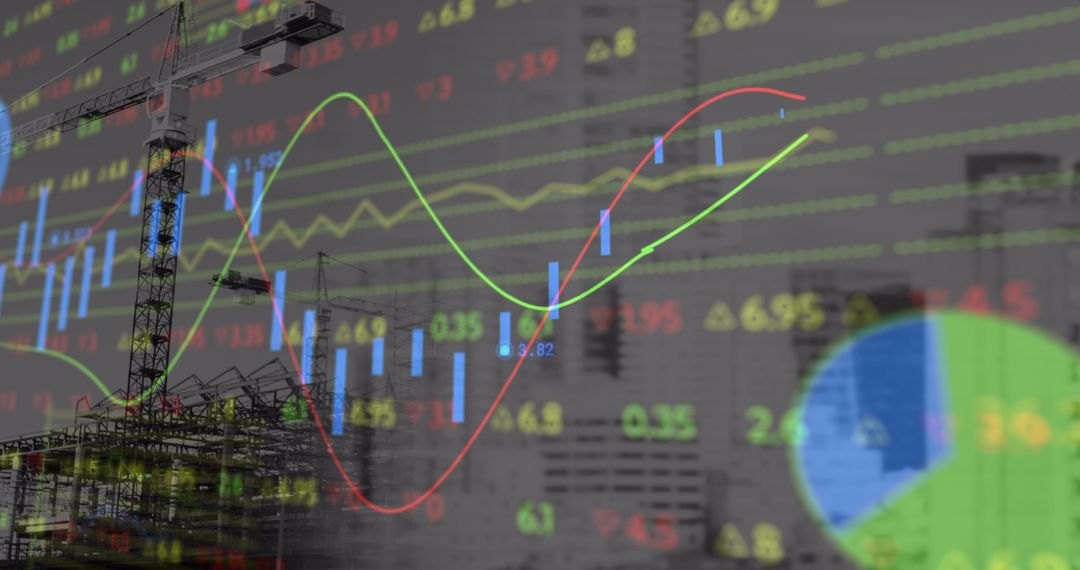
- Binary Codes Monitor with Stock Market Graphs in Motion
Binary Codes Monitor with Stock Market Graphs in Motion Image
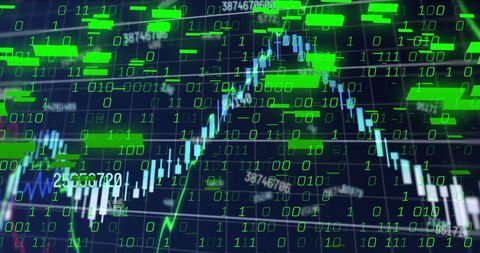
Vibrant green binary numbers overlay on fluctuating financial stock charts, ideal for illustrating financial analytics, cryptocurrency trends, and the digital economy. Use it in content related to financial technology, digital securities trading platforms, or analytical programming environments.
Powered by 


2
downloads
downloads
Tags:
More
Credit Photo
If you would like to credit the Photo, here are some ways you can do so
Text Link
photo Link
<span class="text-link">
<span>
<a target="_blank" href=https://pikwizard.com/photo/binary-codes-monitor-with-stock-market-graphs-in-motion/fdb5506e4ba7a0e6e598b8ef692873f4/>PikWizard</a>
</span>
</span>
<span class="image-link">
<span
style="margin: 0 0 20px 0; display: inline-block; vertical-align: middle; width: 100%;"
>
<a
target="_blank"
href="https://pikwizard.com/photo/binary-codes-monitor-with-stock-market-graphs-in-motion/fdb5506e4ba7a0e6e598b8ef692873f4/"
style="text-decoration: none; font-size: 10px; margin: 0;"
>
<img src="https://pikwizard.com/pw/medium/fdb5506e4ba7a0e6e598b8ef692873f4.jpg" style="margin: 0; width: 100%;" alt="" />
<p style="font-size: 12px; margin: 0;">PikWizard</p>
</a>
</span>
</span>
Free (free of charge)
Free for personal and commercial use.
Author: People Creations
Similar Free Stock Images
Premium


Premium


Premium


Premium


Premium


Premium


Premium


Premium


Premium


Premium


Premium


Premium


Premium


Premium


Premium


Premium


Premium


Premium


Premium


Premium


Premium


Premium


Premium


Premium