- Home >
- Stock Photos >
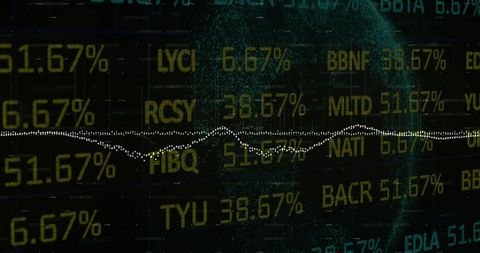
- Binary Data Overlapping Statistical Graphs on Black
Binary Data Overlapping Statistical Graphs on Black Image

Graphs and binary data streams diagonally fill the image, conveying technology-driven analysis in finance or data science. Rows consisting of zeroes and ones float harmoniously beside charts, illustrating technological data interpretation. Could be used for illustrating ideas in modern business analytics, data analysis in telecommunication, or finance with emphasis on processing large data sets efficiently.

downloads
Tags:
More
Credit Photo
If you would like to credit the Photo, here are some ways you can do so
Text Link
photo Link
<span class="text-link">
<span>
<a target="_blank" href=https://pikwizard.com/photo/binary-data-overlapping-statistical-graphs-on-black/756d61d2ae1d0859a3820a0048955c66/>PikWizard</a>
</span>
</span>
<span class="image-link">
<span
style="margin: 0 0 20px 0; display: inline-block; vertical-align: middle; width: 100%;"
>
<a
target="_blank"
href="https://pikwizard.com/photo/binary-data-overlapping-statistical-graphs-on-black/756d61d2ae1d0859a3820a0048955c66/"
style="text-decoration: none; font-size: 10px; margin: 0;"
>
<img src="https://pikwizard.com/pw/medium/756d61d2ae1d0859a3820a0048955c66.jpg" style="margin: 0; width: 100%;" alt="" />
<p style="font-size: 12px; margin: 0;">PikWizard</p>
</a>
</span>
</span>
Free (free of charge)
Free for personal and commercial use.
Author: Authentic Images