
- Home >
- Stock Photos >
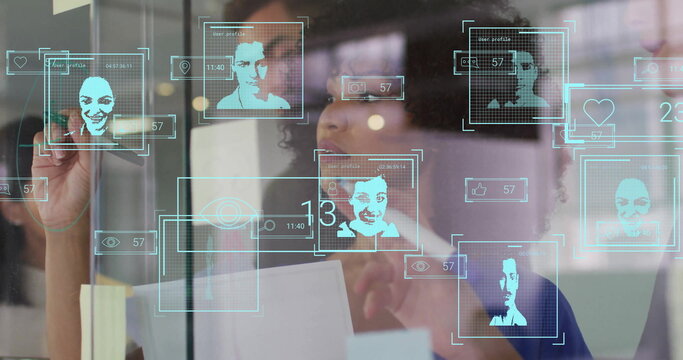
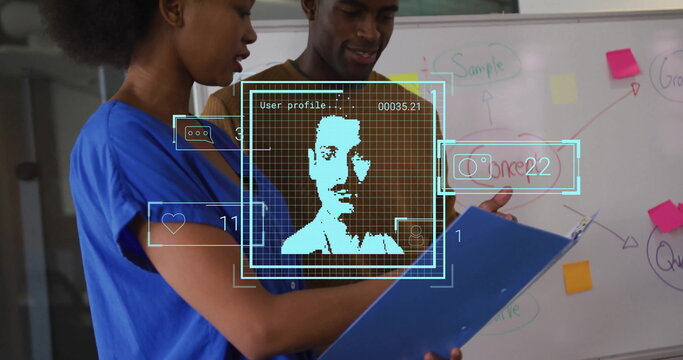
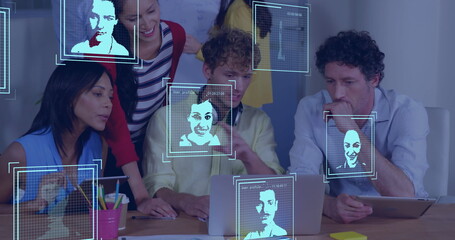
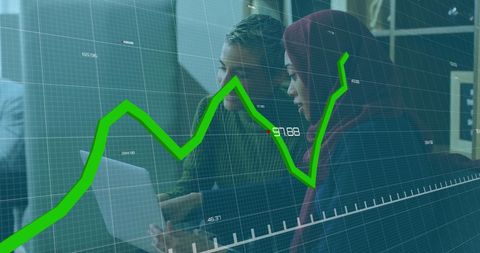
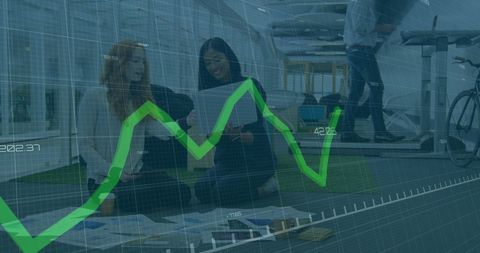
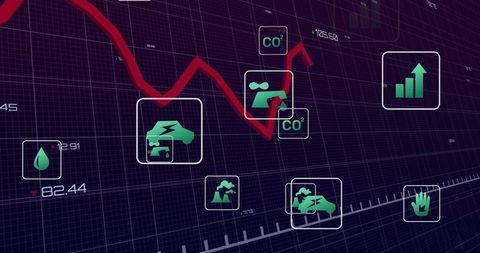
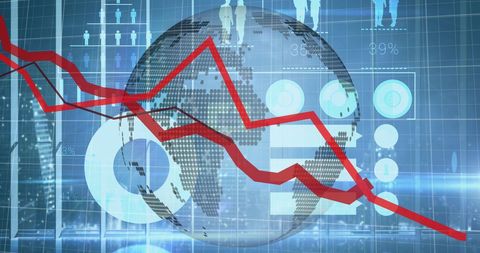
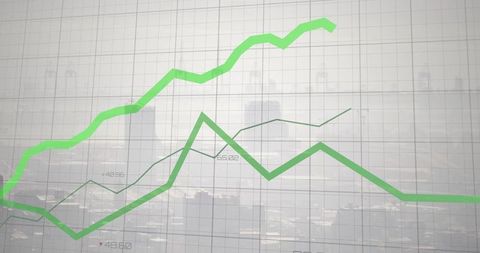
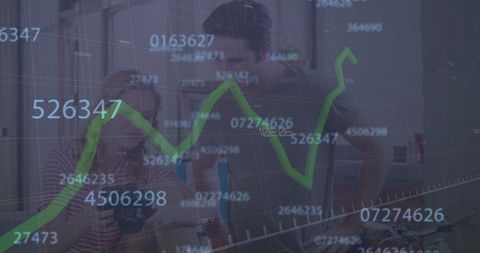
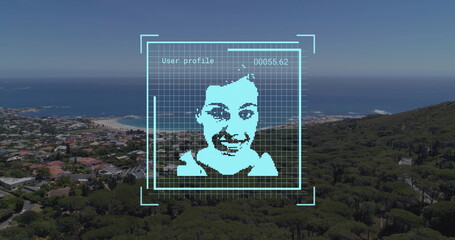
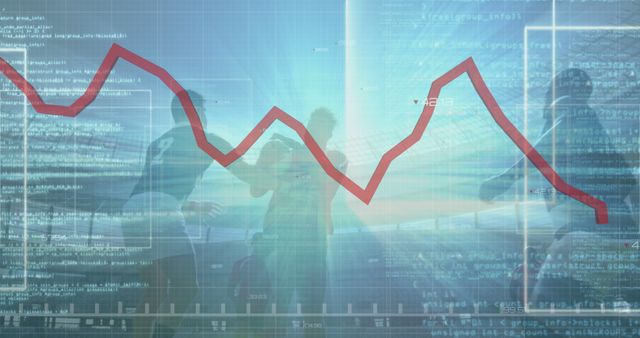
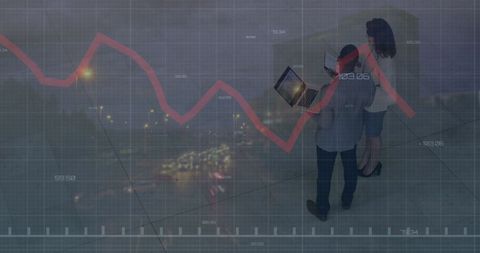
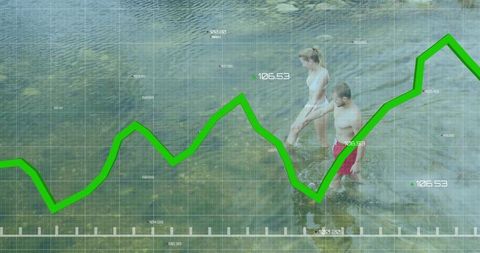
- Biometric Analysis with Financial Data Overlay
Biometric Analysis with Financial Data Overlay Image

Fused representation of biometric technology and financial data insights. Great for illustrating concepts related to cybersecurity in finance, advancements in biometric tech, or using AI in global market analysis. Visually emphasizes trends and integration of multiple data sources.
Powered by 


downloads
Tags:
More
Credit Photo
If you would like to credit the Photo, here are some ways you can do so
Text Link
photo Link
<span class="text-link">
<span>
<a target="_blank" href=https://pikwizard.com/photo/biometric-analysis-with-financial-data-overlay/bfeca646af2f17859f686e78ecaa08a0/>PikWizard</a>
</span>
</span>
<span class="image-link">
<span
style="margin: 0 0 20px 0; display: inline-block; vertical-align: middle; width: 100%;"
>
<a
target="_blank"
href="https://pikwizard.com/photo/biometric-analysis-with-financial-data-overlay/bfeca646af2f17859f686e78ecaa08a0/"
style="text-decoration: none; font-size: 10px; margin: 0;"
>
<img src="https://pikwizard.com/pw/medium/bfeca646af2f17859f686e78ecaa08a0.jpg" style="margin: 0; width: 100%;" alt="" />
<p style="font-size: 12px; margin: 0;">PikWizard</p>
</a>
</span>
</span>
Free (free of charge)
Free for personal and commercial use.
Author: Authentic Images
Similar Free Stock Images
Premium

Premium


Premium


Explore More Free Stock Images