
- Home >
- Stock Photos >
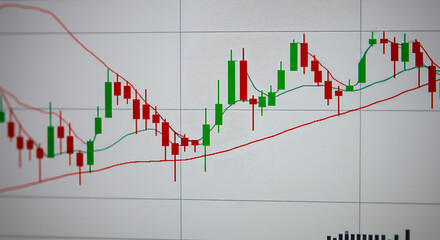
- Bitcoin Trading Financial Analysis Dashboard
Bitcoin Trading Financial Analysis Dashboard Image

Visual representation of fluctuating market data with Bitcoin symbol. Ideal for articles or presentations on cryptocurrency market trends. Useful for blogs discussing impacts of digital currency and investment opportunities.
Powered by 


downloads
Tags:
More
Credit Photo
If you would like to credit the Photo, here are some ways you can do so
Text Link
photo Link
<span class="text-link">
<span>
<a target="_blank" href=https://pikwizard.com/photo/bitcoin-trading-financial-analysis-dashboard/bbf2fdf10f6003178fd118c7eceea5ca/>PikWizard</a>
</span>
</span>
<span class="image-link">
<span
style="margin: 0 0 20px 0; display: inline-block; vertical-align: middle; width: 100%;"
>
<a
target="_blank"
href="https://pikwizard.com/photo/bitcoin-trading-financial-analysis-dashboard/bbf2fdf10f6003178fd118c7eceea5ca/"
style="text-decoration: none; font-size: 10px; margin: 0;"
>
<img src="https://pikwizard.com/pw/medium/bbf2fdf10f6003178fd118c7eceea5ca.jpg" style="margin: 0; width: 100%;" alt="" />
<p style="font-size: 12px; margin: 0;">PikWizard</p>
</a>
</span>
</span>
Free (free of charge)
Free for personal and commercial use.
Author: Creative Art
Similar Free Stock Images

Premium


Premium


Premium


Premium


Premium

Premium


Premium


Premium


Premium


Premium


Premium


Premium

Premium

Premium


Premium


Premium


AI

Premium


Premium


Premium


Premium


Premium


Premium


Premium

Premium


Premium


Explore More Free Stock Images