- Home >
- Stock Photos >
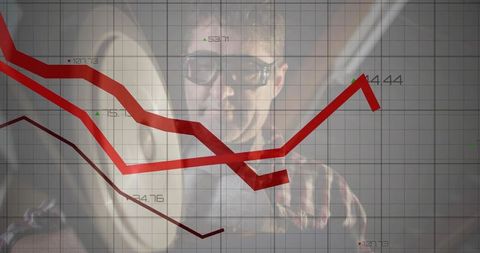
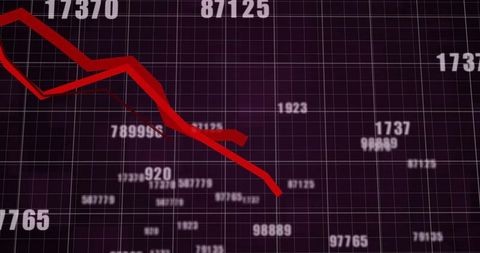
- Bitcoin Value Decline with Red Graph on Grayscale Grid
Bitcoin Value Decline with Red Graph on Grayscale Grid Image

Visual depicting Bitcoin's declining value with red descending graph against grayscale grid, suggesting financial instability. Suitable for illustrating cryptocurrency market analyses, investment impacts due to geopolitical events like Ukraine crisis, and banking or economic articles on digital currencies.

downloads
Tags:
More
Credit Photo
If you would like to credit the Photo, here are some ways you can do so
Text Link
photo Link
<span class="text-link">
<span>
<a target="_blank" href=https://pikwizard.com/photo/bitcoin-value-decline-with-red-graph-on-grayscale-grid/606cb647855e4a9940b95f0554116c8d/>PikWizard</a>
</span>
</span>
<span class="image-link">
<span
style="margin: 0 0 20px 0; display: inline-block; vertical-align: middle; width: 100%;"
>
<a
target="_blank"
href="https://pikwizard.com/photo/bitcoin-value-decline-with-red-graph-on-grayscale-grid/606cb647855e4a9940b95f0554116c8d/"
style="text-decoration: none; font-size: 10px; margin: 0;"
>
<img src="https://pikwizard.com/pw/medium/606cb647855e4a9940b95f0554116c8d.jpg" style="margin: 0; width: 100%;" alt="" />
<p style="font-size: 12px; margin: 0;">PikWizard</p>
</a>
</span>
</span>
Free (free of charge)
Free for personal and commercial use.
Author: Awesome Content