- Home >
- Stock Photos >
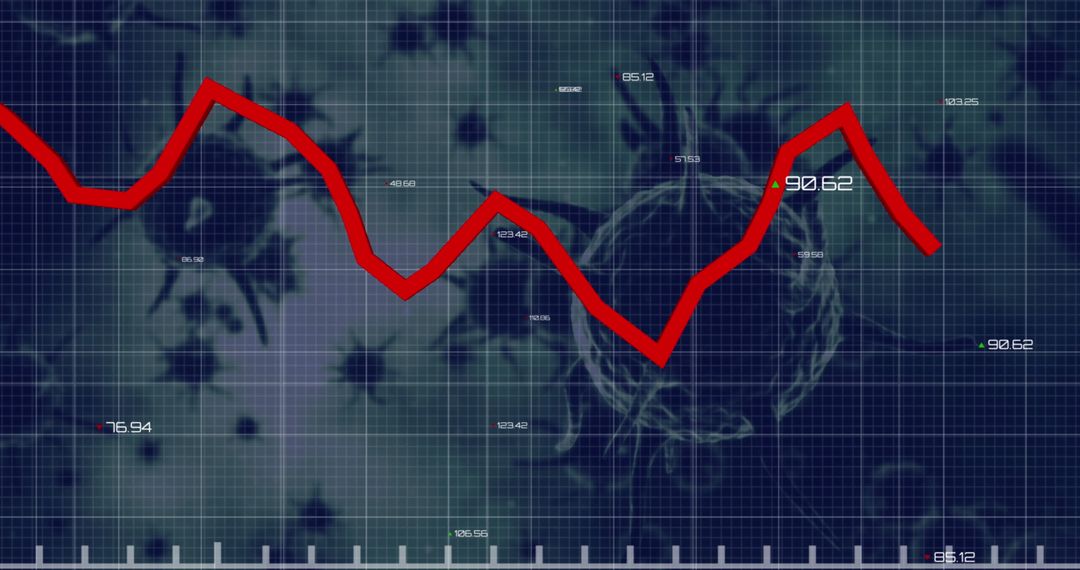
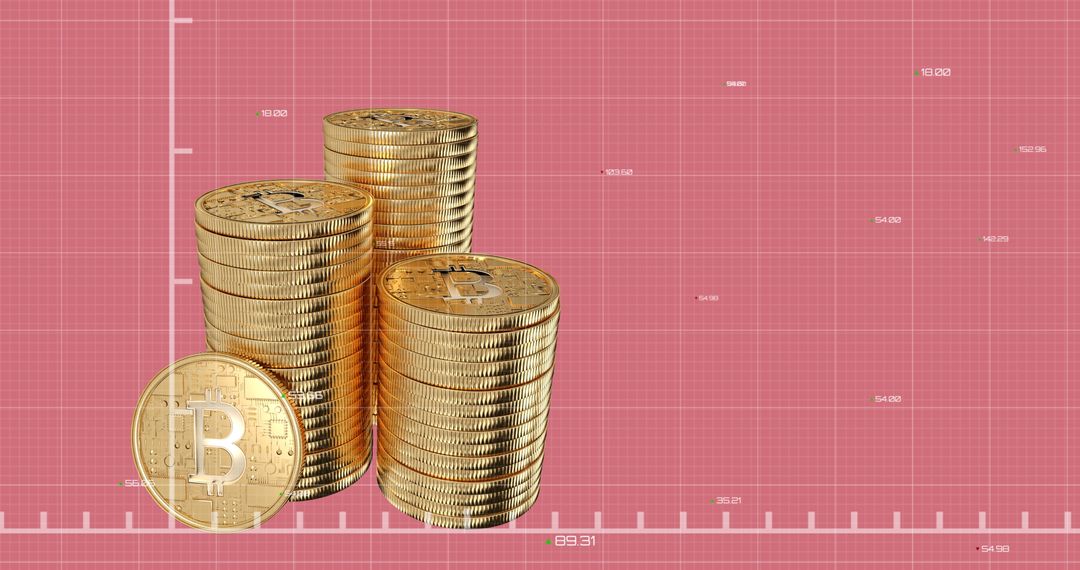
- Bitcoin Volatility with Dice and Plummeting Analytics Chart
Bitcoin Volatility with Dice and Plummeting Analytics Chart Image

Graphic overlay shows a declining red line, symbolizing a decrease in value next to a Bitcoin token and dice, implying the risky and volatile nature of cryptocurrency trading. Useful for articles on crypto market analysis, risk management, and financial prediction challenges.
Powered by 


2
downloads
downloads
Tags:
More
Credit Photo
If you would like to credit the Photo, here are some ways you can do so
Text Link
photo Link
<span class="text-link">
<span>
<a target="_blank" href=https://pikwizard.com/photo/bitcoin-volatility-with-dice-and-plummeting-analytics-chart/64c0feea5763963cbb4dd3b48334b7e4/>PikWizard</a>
</span>
</span>
<span class="image-link">
<span
style="margin: 0 0 20px 0; display: inline-block; vertical-align: middle; width: 100%;"
>
<a
target="_blank"
href="https://pikwizard.com/photo/bitcoin-volatility-with-dice-and-plummeting-analytics-chart/64c0feea5763963cbb4dd3b48334b7e4/"
style="text-decoration: none; font-size: 10px; margin: 0;"
>
<img src="https://pikwizard.com/pw/medium/64c0feea5763963cbb4dd3b48334b7e4.jpg" style="margin: 0; width: 100%;" alt="" />
<p style="font-size: 12px; margin: 0;">PikWizard</p>
</a>
</span>
</span>
Free (free of charge)
Free for personal and commercial use.
Author: Awesome Content
Similar Free Stock Images

Premium


Premium


Premium


Premium


Premium


Premium


Premium


Premium


Premium


Premium


Premium


Premium


Premium


Premium


Premium


Premium


Premium


Premium


Premium


Premium


Premium


Premium


Premium


Premium