1. Home > 
  2. Stock Photos > 
  3. Black Background with Floating Financial Data Elements

Black Background with Floating Financial Data Elements Image

Black Background with Floating Financial Data Elements

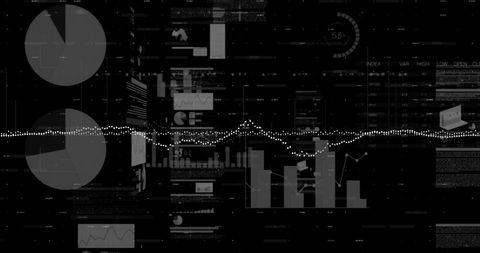
Visually immersive depiction of financial charts, graphs, and data overlays floating on a black background, symbolizing trendy analytics visualizations or modern technical subjects. Use this stock photo for presentations, backgrounds, reports, or web design in financial markets, corporate strategies, and data science sectors.

Powered by Adobe logo
Business professionals collaborate to analyze financial data while chart graphics illustrate market growth, trends, and economic insights in a modern office setting. Scalp - Powered by AdobeAbstract digital landscape with glowing blue wave patterns, data visualization in technology, financial analytics and modern graphics representation - Powered by Adobeabstract colorful bar graph showing business growth and financial success with data analysis and market trends for corporate presentation and website - Powered by AdobeCollection of financial and data visualization graphics - Powered by AdobeProfessional businessman in a smart suit holding a digital tablet with financial data graphics on a transparent background - Powered by Adobe

Credit Photo

If you would like to credit the Photo, here are some ways you can do so

Free (free of charge)

Free for personal and commercial use.

Author: Creative Art

Similar Free Stock Images

Dynamic Stock Market Concept with Colorful Line Graphs
Premium
Dynamic Stock Market Chart Displays Vibrant Price Movements in Glowing Blue and Orange
Dynamic Digital Stock Market Ticker with Growing Graph Trends
Financial Data Streaming with Arrows Over Graphic Indicators
Financial Data and Risk Management Analysis in Global Context
Abstract Mobile Glitch Chart with Digital Lines and Numbers
Premium
A close-up of a laptop screen displaying a financial chart with colorful lines and bars, indicating market trends and data analysis.
Dynamic Financial Graphs Over Cityscape Background
Abstract Financial Data and Global Analysis Graphics
Dynamic Financial Data Streams for Market Analysis
Dynamic Stock Market Analysis with Trend Lines
Premium
Orange financial charts over city skyline at sunset stock market trading
Analyzing Financial Market Trends with Data Visualization
Digital Financial Data Analysis Overlay in Modern Office
Declining Graph Overlay on Night Traffic Scene Illustrates Downtrend
Digital Financial Chart Showing Growth and Dynamic Indicators
Premium
Close-up of digital financial charts and graphs on a dark blue background, with orange accents. Data visualization, charts, and graphics.
Digital Finance Analytics and Technological Data Visualization
Dynamic Financial Data Displayed on Neon Graphs
Dynamic Financial Data Against Urban Skyline
Dynamic Stock Market Data Analysis With Graphs and Percentages
Premium
Isometric data analytics platform with a growing bar chart. Digital technology and business intelligence concept for financial growth.
Digital Data Visualization with Graph Charts on Dark Background
Dynamic Stock Market Data Visualization for Financial Analysis
Financial Data Analytics on Digital Interface
Digital Financial Data Visualization on Dark Screen
Premium
Professional Indian businessman using a digital tablet in a modern office, surrounded by futuristic financial graphics
Digital Data Analysis on Futuristic Black Background
Dynamic Financial Data Trends with Fluctuating Graphs and Charts
Interactive Data Visualization Dashboard with Trend Analysis
Futuristic Digital Dashboard Overlay with Data Visualizations
Dynamic Stock Market Graph with Vibrant Color Lines on Grid
Colorful Stock Market Graph with Data on Grid
Premium
Wind turbine silhouette against a vibrant sunset sky, with overlaid financial data charts, symbolizing renewable energy investment and market trends in a modern landscape
Abstract Financial Data Illustration with Graphs and Global Elements
Analyzing Financial Data with Graphs and Charts
Digital Financial Data Representation with Abstract Graph
Dynamic Financial Data Analytics Interface with Blue Background
Premium
Business people with charts and devices in formal attire over city background, abstract graphics overlaying, concept of teamwork and financial analysis
Global Financial Data Analysis with World Map Visualization
Financial Data Analytics on Digital Interface Displaying Graphs
Digital Financial Data Analysis Over Modern Server Center
Dynamic Financial Graph on Digital Background
Premium
Business professional writing the word tax next to growing financial graphs in a dark setting
Financial Data Visualization with Line and Bar Graphs
Digital Globe with Intersecting Graphs Representing Global Economy
Abstract Digital Waveform in Data Processing Visualization
Digital Financial Data and Multicurrency Exchange Charts
Premium
Close-up of hands typing on laptop with financial data and human resource graphics
Digital Financial Graphs and Market Data Analysis
Dynamic Financial Data Visual Display with Graph Annotations
Dynamic Data Analytics Interface Showing Statistical Trends
Dynamic Financial Data Analytics and Stock Market Trends
Premium
Business analytics dashboard floating user interface with financial data icons
Financial Market Decline with Red Line Graph Overlay
Futuristic Financial Data Analysis with Graphs and Charts
Digital Financial Data Analysis with Global Technological Interface
Global Financial Data with Dynamic Analytics Visualization
Premium
Business team calculate benefit, working woman, spreadsheets, graph financial development, bank accounts, statistics, economy, data analysis, investment analysis, stock exchange, rates income
Digital Interface with Data Analysis and Code in Console
Futuristic Financial Dashboard with Holographic Graphs
Futuristic Data Dashboard with Waveform and V-shaped Graph
Dynamic Financial Data Graph in Digital Grid Display
Colorful Stock Market Display with Graphs and Tickers on Blue Background
Abstract Global Financial Data Visualization Concept
Premium
Stock market graph with blue technology background, financial trading analysis chart, investment growth data visualization, economic business concept
Abstract Financial Data With Digital Interface Graphs
Digital Financial Graph and Data Display on Blue Background
Digital Financial Data Visualization with Urban Cityscape
Financial Data Analysis Over Vibrant Cityscape Background
Premium
A detailed architectural model of a bank building, featuring classical columns, set against a backdrop of financial data and trends.
Dynamic Stock Market Data Visualization on Digital Screen
Financial Data Analysis Overlaying Server Room
Digital Stock Market Data Over Cityscape Concept
Dynamic Multicolored Graphs on Abstract Digital Finance Background
Premium
Abstract financial chart with glowing data lines and symbols, futuristic digital style, on a blurred grid background, concept of market analysis and trading, 3D Rendering
Digital Lights and Media Icons on Black Background
Digital Analysis of Financial Data with Dynamic Graphs
Dynamic Financial Data Analytics Display with Graphs
Animated Financial Data with Heartbeat Overlapping Lines
Premium
Isometric data visualization elements and business analytics graphics, featuring various charts, graphs, and database representations for financial reporting and technological insights
Financial Data Displayed with Trends on Blue Background
Financial Data Visualization with Increasing Graph Trend
Dynamic Data Graph on Dark Digital Grid Background
Abstract Data Visualization with Neon Waveforms
Premium
Businessman analyzing company financial balance sheet working with digital virtual graphics Businessman calculating financial data for long term investment growth goals, vertical
Digital Data Waveform on High-Tech Interface
Financial Graphs Over Candlestick Chart Indicating Stock Fluctuations
Dynamic Stock Market Graph with Fluctuating Data Bars
Abstract Digital Data Analytics on Dark Background
Premium
Growth chart business strategy up arrow graph finance stock market or increase money profit diagram on financial concept success economy investment background with digital .
Dynamic Colorful Waveform Curves on Digital Grid Interface
Dynamic Waveform with Math Symbols on Scientific Digital Background
Colorful Stock Market Graph on Dark Grid Background Illustrating Global Economy Trends
Dynamic Stock Market Trends with Graphs on Digital Display
Financial Data Visualization on Black Background
Global Financial Data and Analytics Concept with Rising Arrow
Premium
Futuristic Cityscape with Digital Financial Graphics and World Map Overlay
Digital Charts and Financial Data Background in Blue Tones
Abstract Financial Data Overlay on City Skyline Imagery
Financial Graph Over Cityscape Depicting Data Trends and Analytics
Abstract Digital Statistical Data Analysis Backdrop
Premium
Business woman checking statistics
Financial Data Display in Digital Grid Design
Financial Data Charts and Graphs on Digital Interface
Financial Data Processing with Digital Patterns for Global Business
Financial Data Processing with Graphs and Charts
Premium
A vivid and vibrant city skyline that showcases digital graphs symbolizing rising data trends and analytics
Financial Growth Graph and Data Analytics Representation
Stock Market Trends Digital Display with Fluctuating Graph
Glowing Data Graph Overlay on Spinning Black Globe
Stock Market Graph and Data Analysis
Premium
A business professional engages in data analysis on a laptop, surrounded by digital graphics depicting growth trends, emphasizing modern office productivity and financial strategy. Scalp
Financial Graphs and Digital Data on Dark Background
Abstract Financial Data Visualization on Dark Digital Grid
Stock Market Analysis with Graphs and Trading Data
Financial Data Analysis with Growing Stock Trends
Premium
Abstract financial chart showing candlestick graph representing business growth in blue tones
Abstract Data Wave Patterns on Technology Interface
Binary Code Flowchart Background with Digital Animation
Financial Charts with Data Analysis Overlays on Abstract Lines
Business Professionals Analyzing Financial Growth Figures
Premium
Abstract financial chart with glowing data lines and symbols, futuristic digital style, on a blurred grid background, concept of market analysis and trading, 3D Rendering
Neon Market Momentum: Multicolor Candlestick Price Line Climbing on Dark Trading Dashboard