- Home >
- Stock Photos >
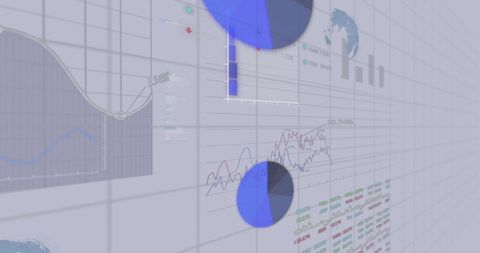
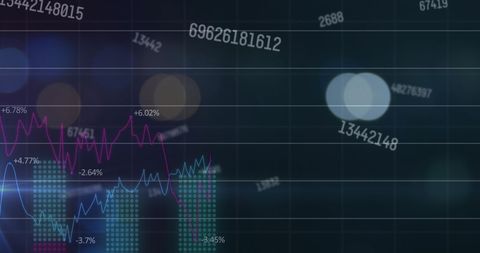
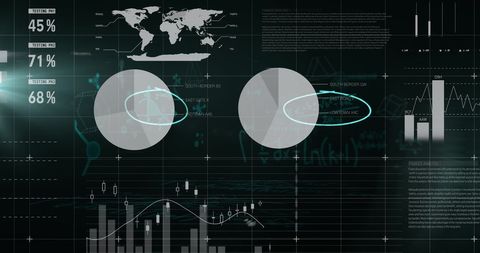
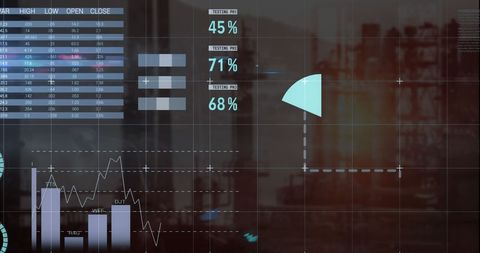
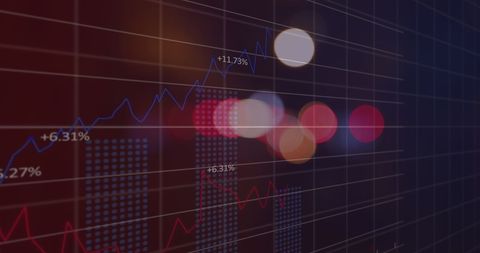
- Blending Financial Data Visualization with Abstract Tech Elements
Blending Financial Data Visualization with Abstract Tech Elements Image
Depiction showcases abstract financial data and graphs interwoven with blurred light elements, suggesting atmosphere of complexity and analysis. Ideal for illustrating topics in financial technology, data analysis, and economic research. Could be used in business presentations, investment guides, or articles about market trends and analytics tools, underscoring theme of modern finance.

downloads
Tags:
More
Credit Photo
If you would like to credit the Photo, here are some ways you can do so
Text Link
photo Link
<span class="text-link">
<span>
<a target="_blank" href=https://pikwizard.com/photo/blending-financial-data-visualization-with-abstract-tech-elements/177f427a7d3fdde98029e1fa9af91edb/>PikWizard</a>
</span>
</span>
<span class="image-link">
<span
style="margin: 0 0 20px 0; display: inline-block; vertical-align: middle; width: 100%;"
>
<a
target="_blank"
href="https://pikwizard.com/photo/blending-financial-data-visualization-with-abstract-tech-elements/177f427a7d3fdde98029e1fa9af91edb/"
style="text-decoration: none; font-size: 10px; margin: 0;"
>
<img src="https://pikwizard.com/pw/medium/177f427a7d3fdde98029e1fa9af91edb.jpg" style="margin: 0; width: 100%;" alt="" />
<p style="font-size: 12px; margin: 0;">PikWizard</p>
</a>
</span>
</span>
Free (free of charge)
Free for personal and commercial use.
Author: Creative Art