- Home >
- Stock Photos >
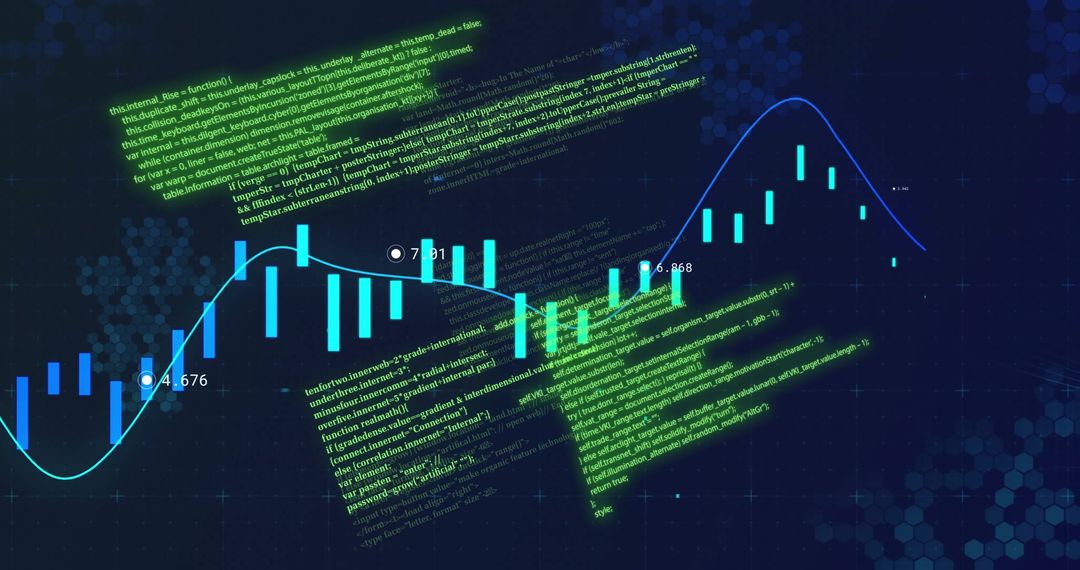
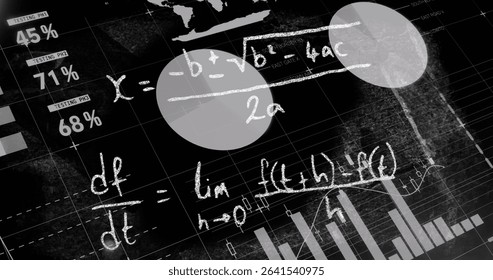
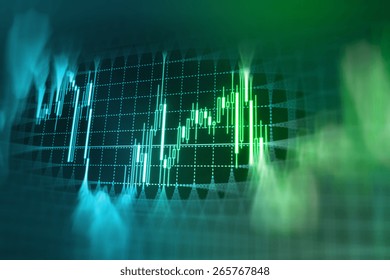
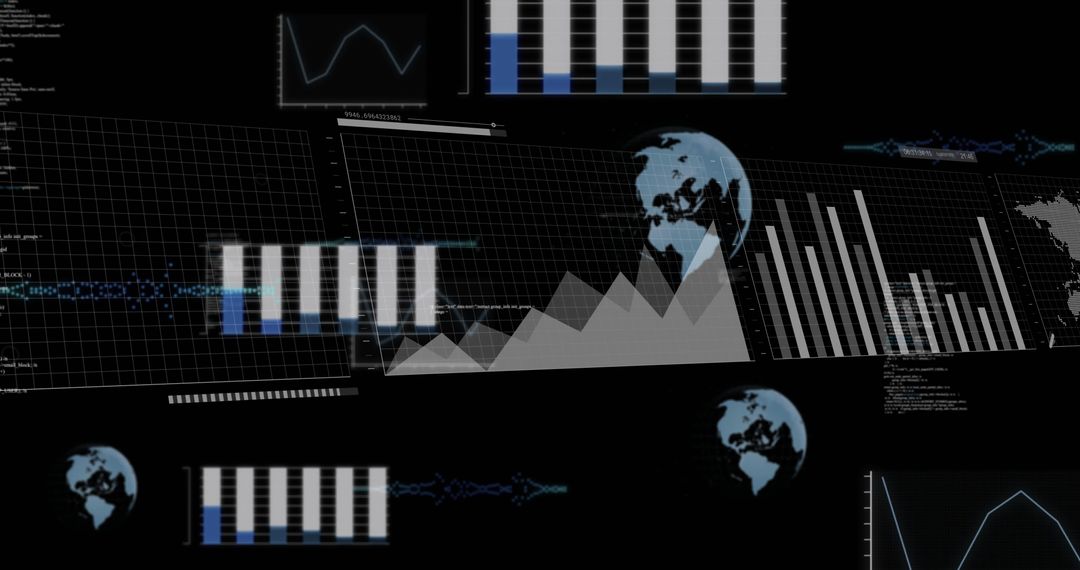
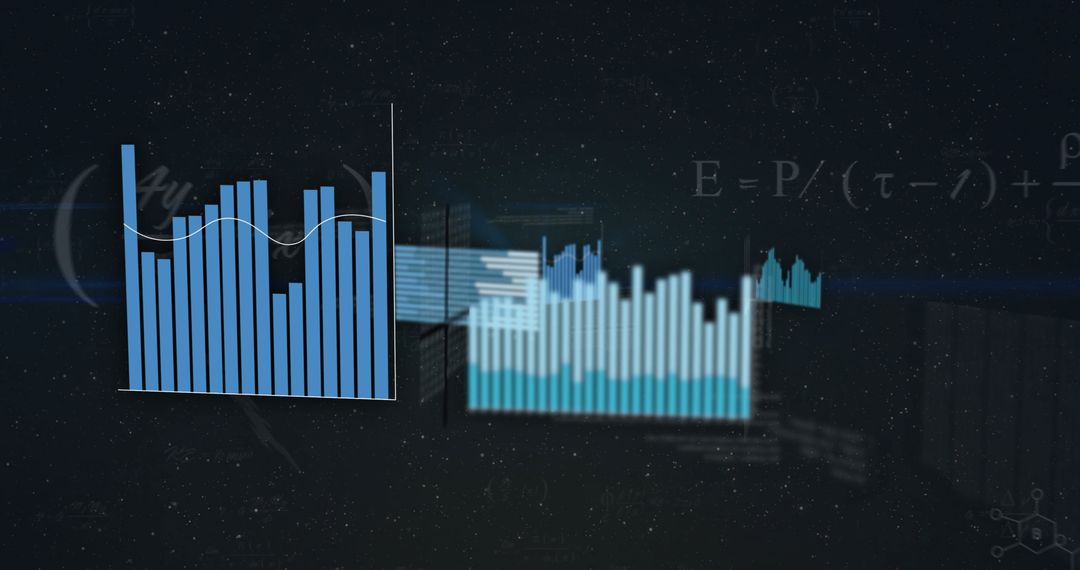
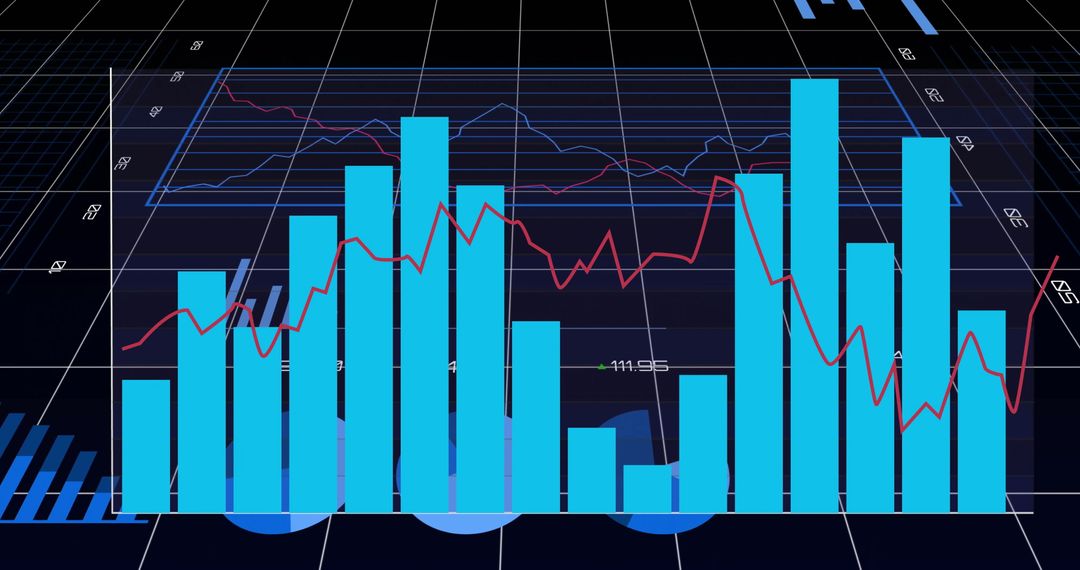
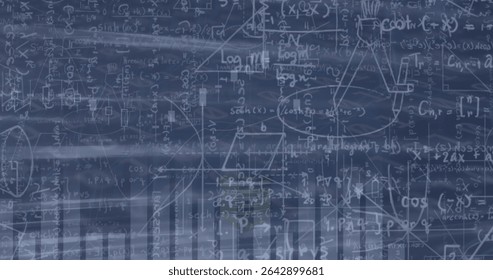
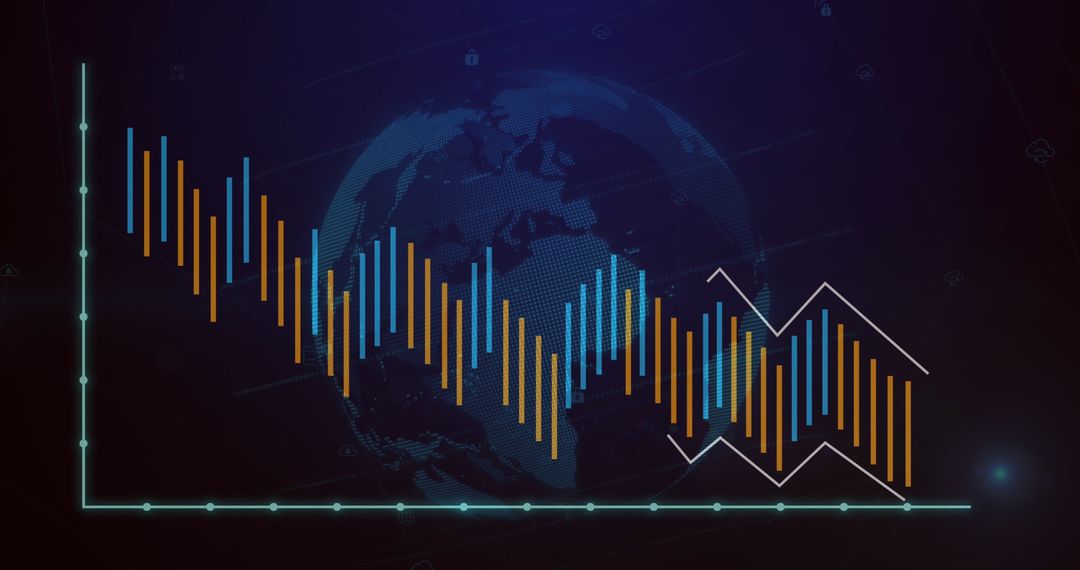
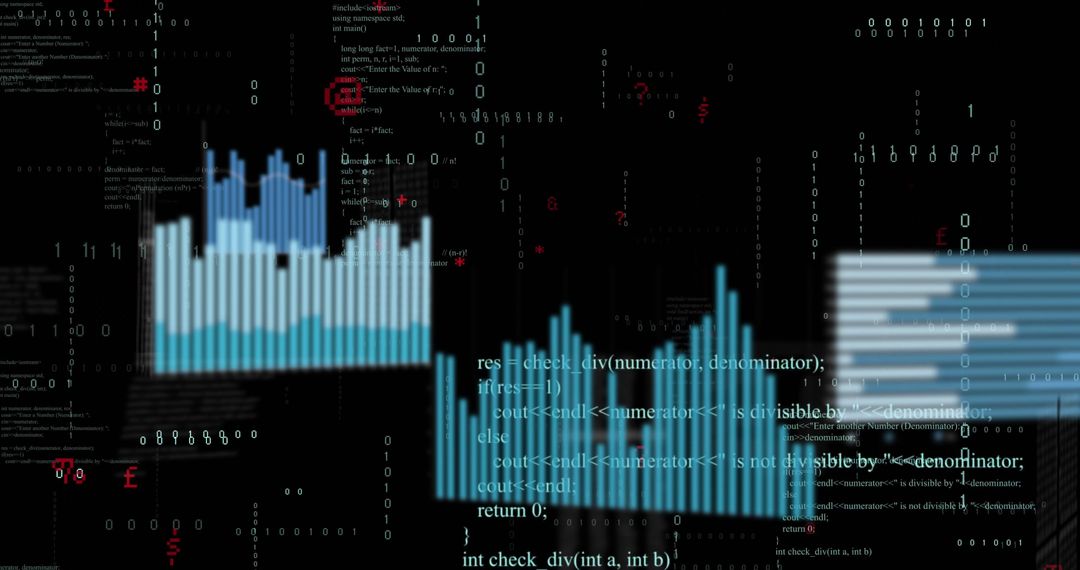
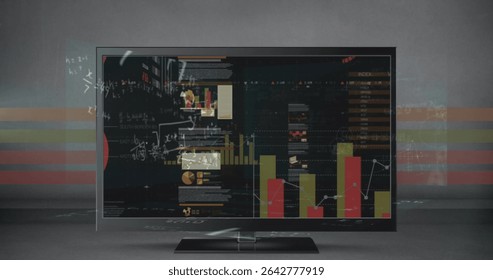
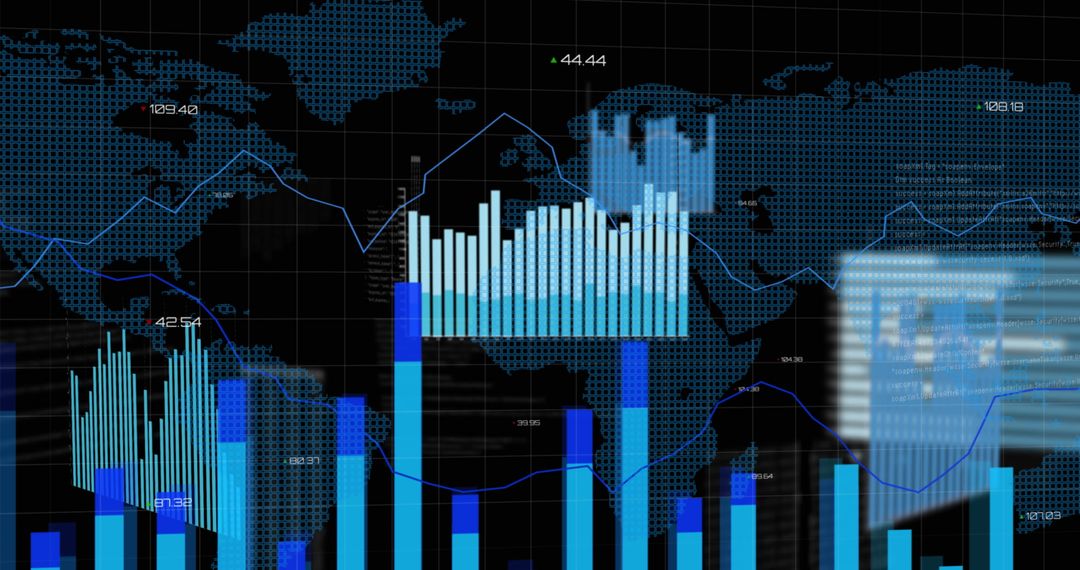
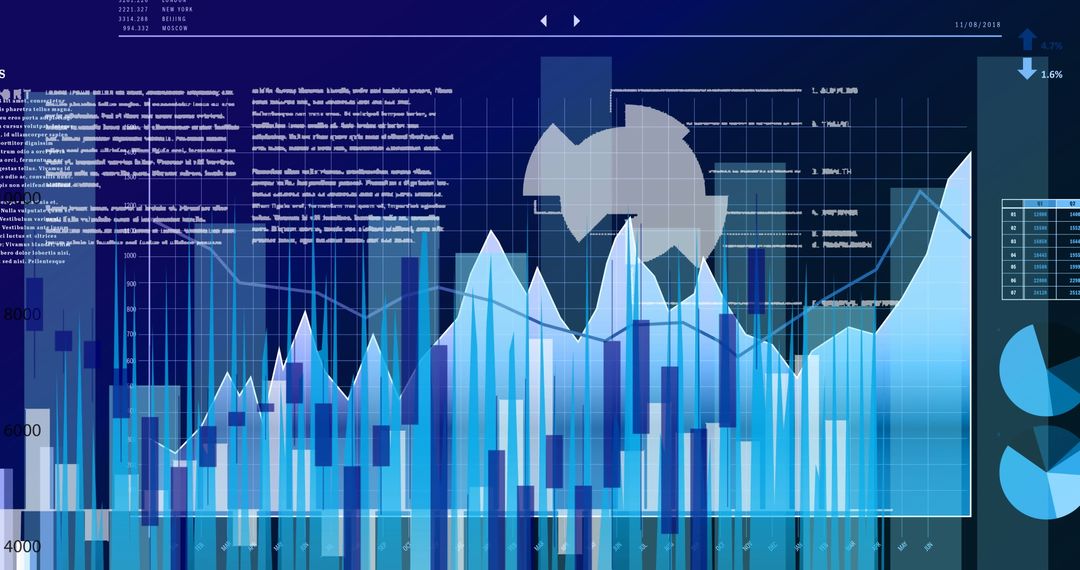
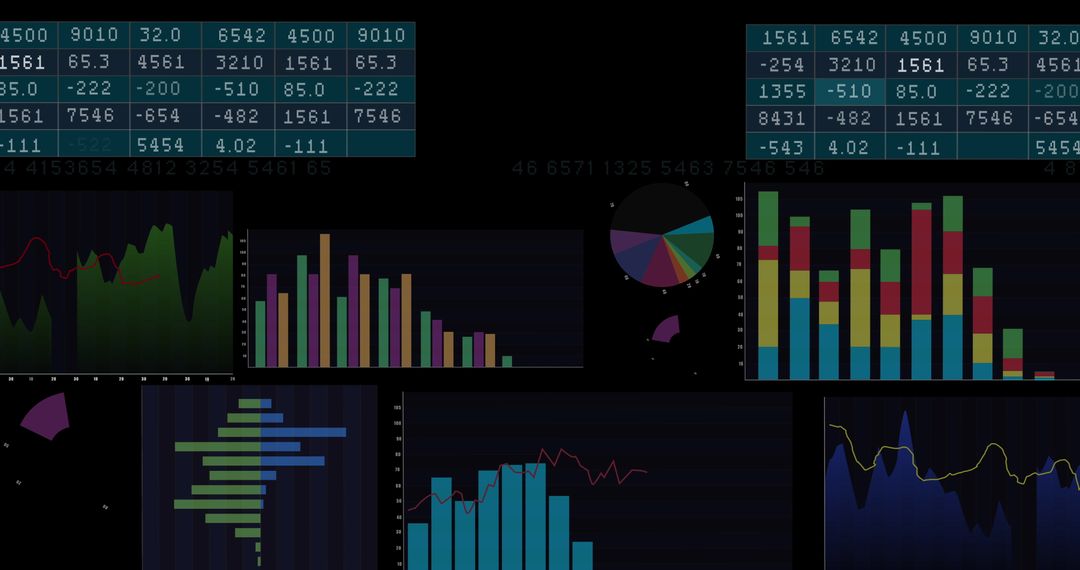
- Blending handwritten mathematics and blue bar chart visualizations on blackboard background
Blending handwritten mathematics and blue bar chart visualizations on blackboard background Image

Showing handwritten mathematical equations, formulas, and diagrams sketched on blackboard while blue bar chart data visualizations overlay. Balancing chalk-style algebra, geometry, and calculus notation with digital analytics graphics. Suggesting cropping for banner or square formats, increasing contrast for print, and applying transparent overlay for headline text. Recommending use for education campaigns, STEM marketing, data science branding, textbook covers, presentation slides, blog headers, social media posts, and classroom posters. Suitable for web hero banners, conference materials, online course thumbnails, and editorial illustrations about research, analytics, or teaching. Color palette featuring black background, white chalk lines, and cool blue chart accents.
Powered by  - Get 15% off with code: PIKWIZARD15


0
downloads
downloads
Tags:
More
Credit Photo
If you would like to credit the Photo, here are some ways you can do so
Text Link
photo Link
<span class="text-link">
<span>
<a target="_blank" href=https://pikwizard.com/photo/blending-handwritten-mathematics-and-blue-bar-chart-visualizations-on-blackboard-background/a49db462c394a8b1ea264205b97b67e5/>PikWizard</a>
</span>
</span>
<span class="image-link">
<span
style="margin: 0 0 20px 0; display: inline-block; vertical-align: middle; width: 100%;"
>
<a
target="_blank"
href="https://pikwizard.com/photo/blending-handwritten-mathematics-and-blue-bar-chart-visualizations-on-blackboard-background/a49db462c394a8b1ea264205b97b67e5/"
style="text-decoration: none; font-size: 10px; margin: 0;"
>
<img src="https://pikwizard.com/pw/medium/a49db462c394a8b1ea264205b97b67e5.jpg" style="margin: 0; width: 100%;" alt="" />
<p style="font-size: 12px; margin: 0;">PikWizard</p>
</a>
</span>
</span>
Free (free of charge)
Free for personal and commercial use.
Author: Authentic Images
Similar Free Stock Images

Premium


Premium


Premium


Premium


Premium


Premium


Premium


Premium

Premium


Premium


Premium


Premium


Premium


Premium


Premium


Premium


Premium


Premium