- Home >
- Stock Photos >
- Blockchain Data Analysis with Digital Dashboard Interactive Interface
Blockchain Data Analysis with Digital Dashboard Interactive Interface Image
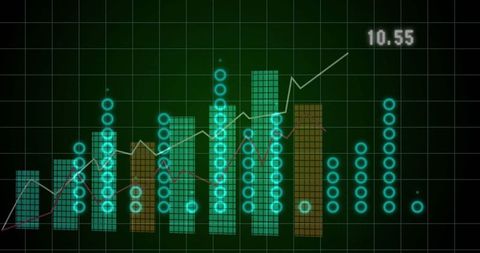
Digital representation of financial or statistical graph featuring teal and brown bar structures, complemented by cyan circular markers plotted alongside a rising trendline indicator highlighted in white, numbered at 10.55. This visual signifies data analytics, providing insight into statistical fluctuations and trends. Valuable for financial reports, business analytics presentations, and educational resources on technology integration in stats analysis and digital interface content. Ideal for content requiring professional insight into data patterns and interactive visualization methods.

downloads
Credit Photo
If you would like to credit the Photo, here are some ways you can do so
Free (free of charge)
Free for personal and commercial use.
Author: Awesome Content