- Home >
- Stock Photos >
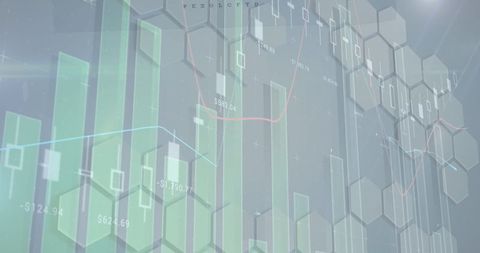
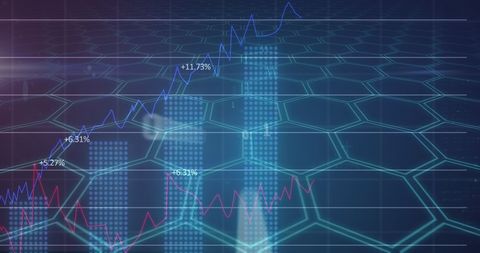
- Blockchain Financial Data Visualization with Hexagonal Patterns
Blockchain Financial Data Visualization with Hexagonal Patterns Image
Financial data and blockchain analysis visualized through interpretive hexagonal graphs represent advancements in digital finance technology. Ideal for illustrating concepts in blockchain technology, financial trading platforms, modern data analytics innovations, or articles focusing on the growing relevance of cryptocurrencies and global connections.

downloads
Tags:
More
Credit Photo
If you would like to credit the Photo, here are some ways you can do so
Text Link
photo Link
<span class="text-link">
<span>
<a target="_blank" href=https://pikwizard.com/photo/blockchain-financial-data-visualization-with-hexagonal-patterns/58565310ef0cb2bcba76544478221656/>PikWizard</a>
</span>
</span>
<span class="image-link">
<span
style="margin: 0 0 20px 0; display: inline-block; vertical-align: middle; width: 100%;"
>
<a
target="_blank"
href="https://pikwizard.com/photo/blockchain-financial-data-visualization-with-hexagonal-patterns/58565310ef0cb2bcba76544478221656/"
style="text-decoration: none; font-size: 10px; margin: 0;"
>
<img src="https://pikwizard.com/pw/medium/58565310ef0cb2bcba76544478221656.jpg" style="margin: 0; width: 100%;" alt="" />
<p style="font-size: 12px; margin: 0;">PikWizard</p>
</a>
</span>
</span>
Free (free of charge)
Free for personal and commercial use.
Author: People Creations