- Home >
- Stock Photos >
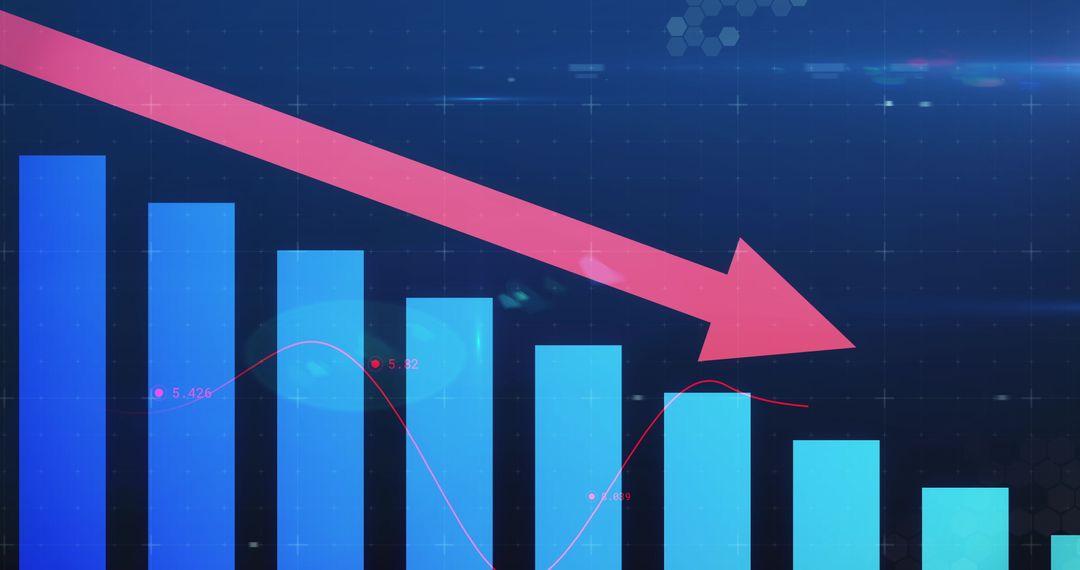
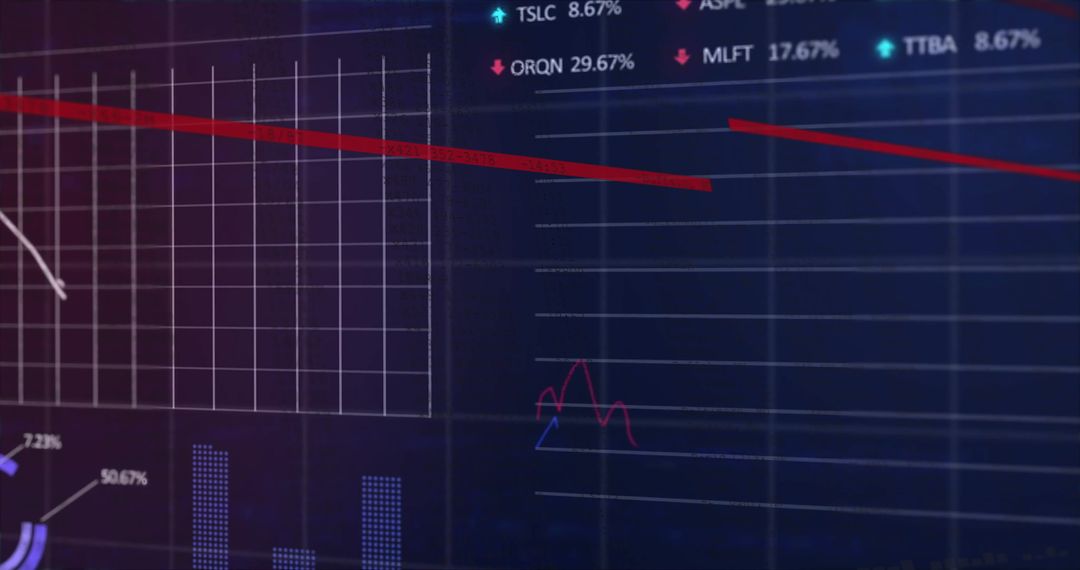
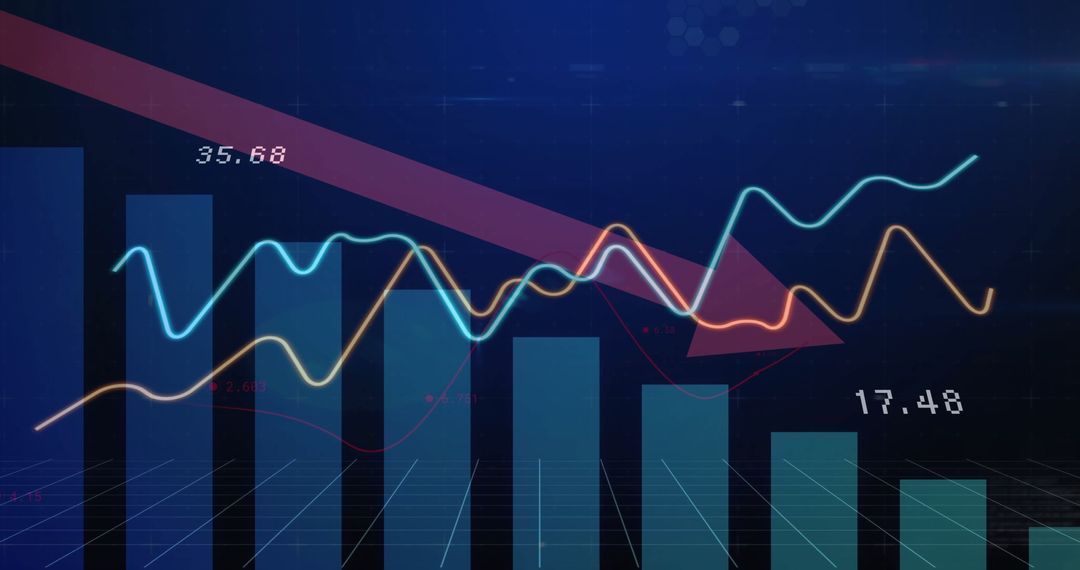
- Blue Bar Chart with Downward Pink Arrow Showing Data Trend
Blue Bar Chart with Downward Pink Arrow Showing Data Trend Image

Visual representing data analytics with blue bar chart and prominent pink downward arrow. Useful for illustrating a declining trend in economic or business reports, visual presentations, or digital dashboards focusing on market analysis and performance insights.
Powered by 


2
downloads
downloads
Tags:
More
Credit Photo
If you would like to credit the Photo, here are some ways you can do so
Text Link
photo Link
<span class="text-link">
<span>
<a target="_blank" href=https://pikwizard.com/photo/blue-bar-chart-with-downward-pink-arrow-showing-data-trend/07c5620512066afe5873c6339b8bd1f6/>PikWizard</a>
</span>
</span>
<span class="image-link">
<span
style="margin: 0 0 20px 0; display: inline-block; vertical-align: middle; width: 100%;"
>
<a
target="_blank"
href="https://pikwizard.com/photo/blue-bar-chart-with-downward-pink-arrow-showing-data-trend/07c5620512066afe5873c6339b8bd1f6/"
style="text-decoration: none; font-size: 10px; margin: 0;"
>
<img src="https://pikwizard.com/pw/medium/07c5620512066afe5873c6339b8bd1f6.jpg" style="margin: 0; width: 100%;" alt="" />
<p style="font-size: 12px; margin: 0;">PikWizard</p>
</a>
</span>
</span>
Free (free of charge)
Free for personal and commercial use.
Author: Authentic Images