- Home >
- Stock Photos >
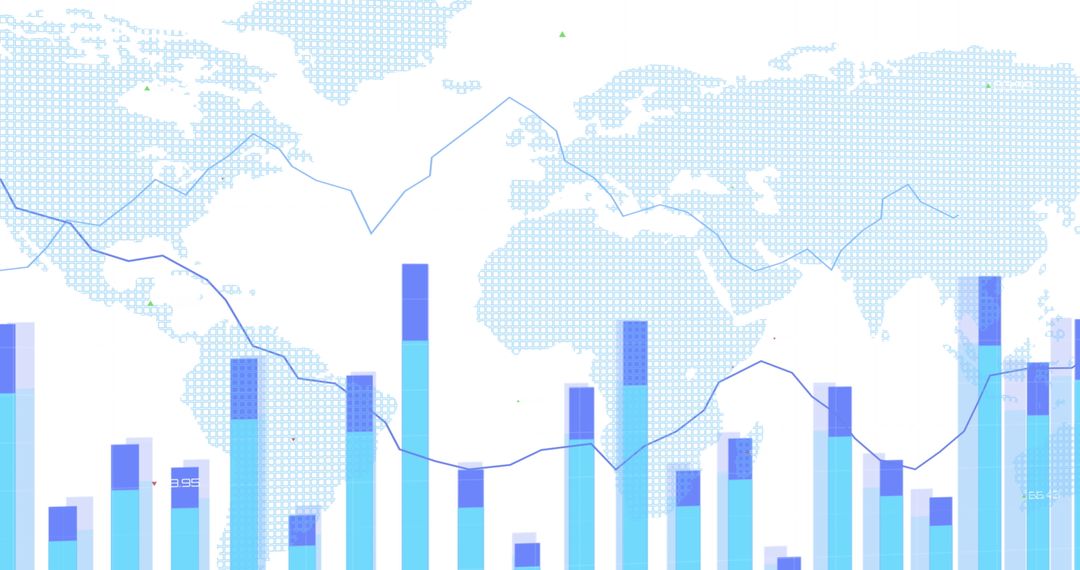
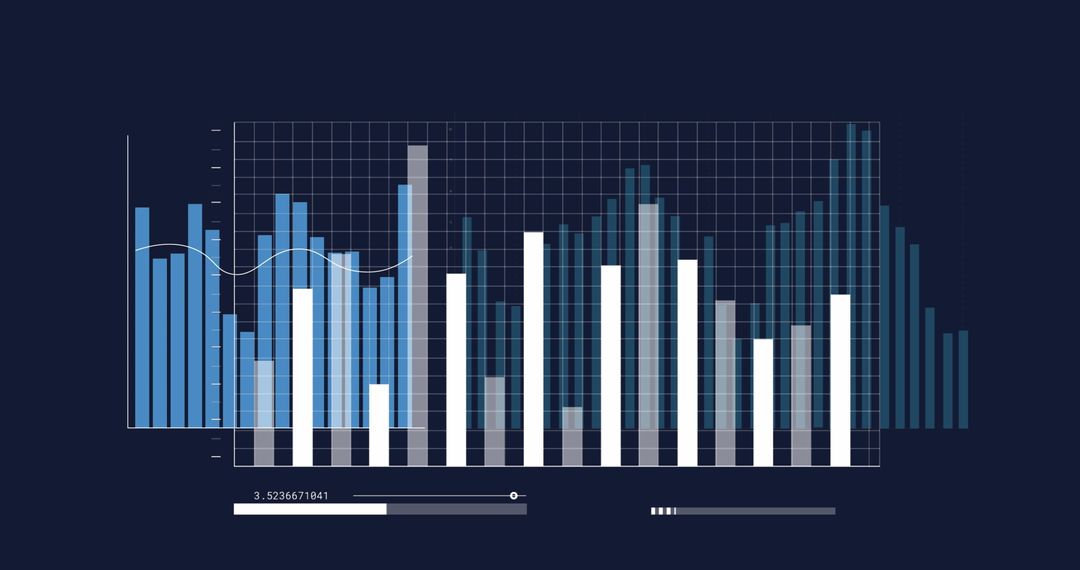
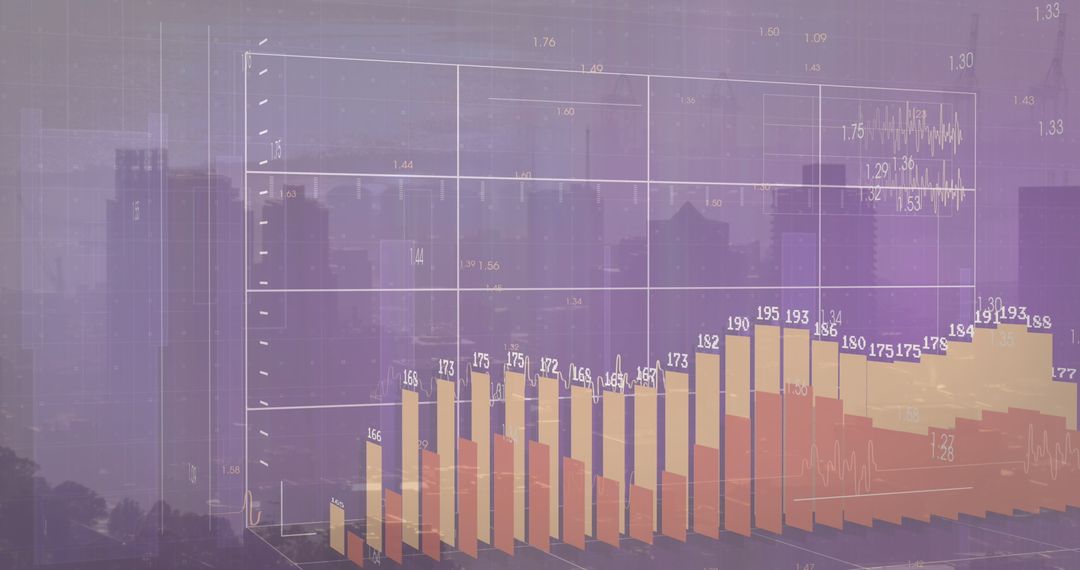
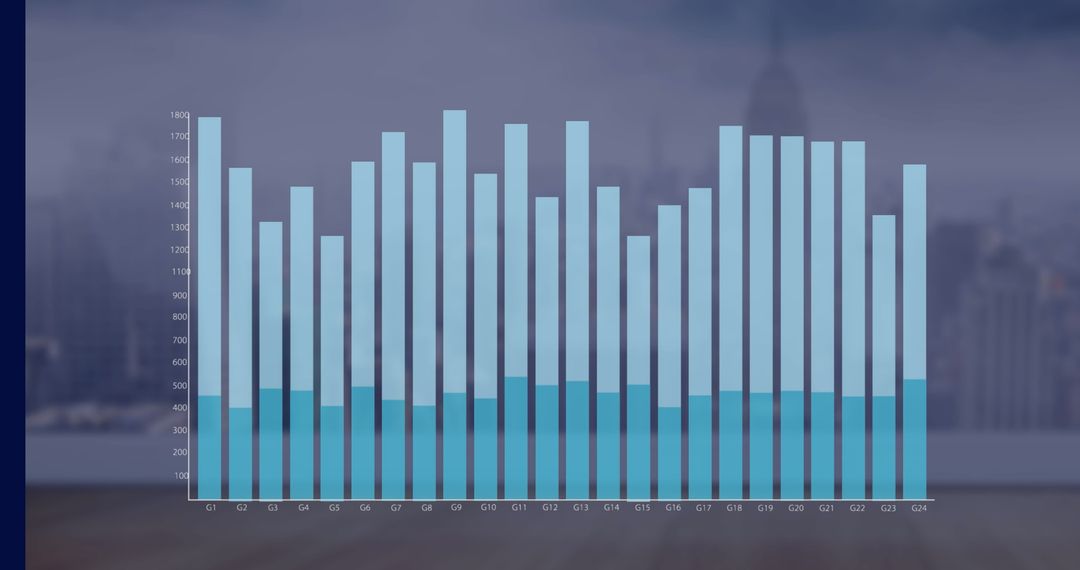
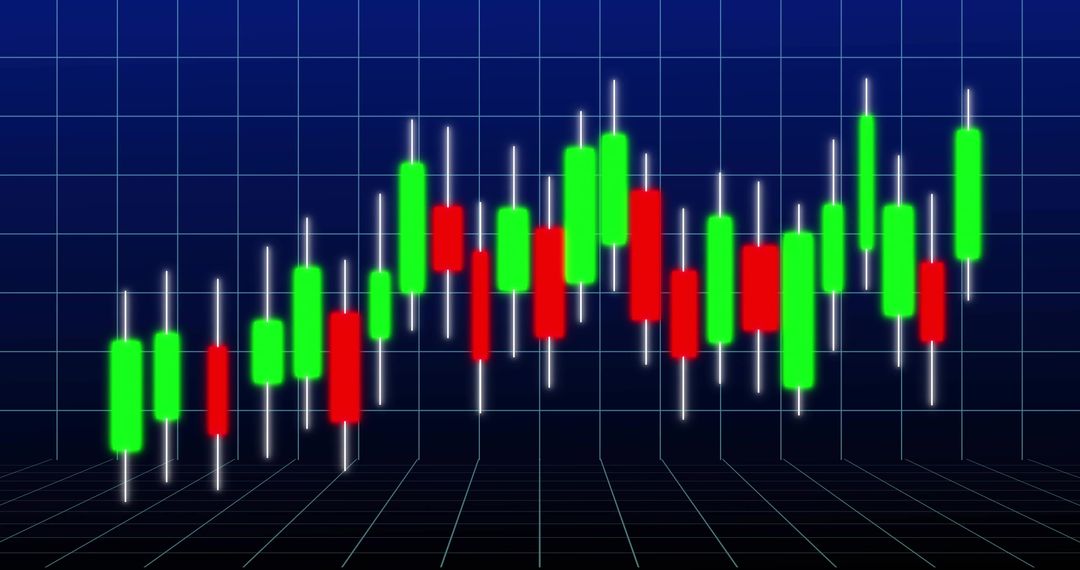
- Blue Bar Chart with Trend Line on Grid Background
Blue Bar Chart with Trend Line on Grid Background Image
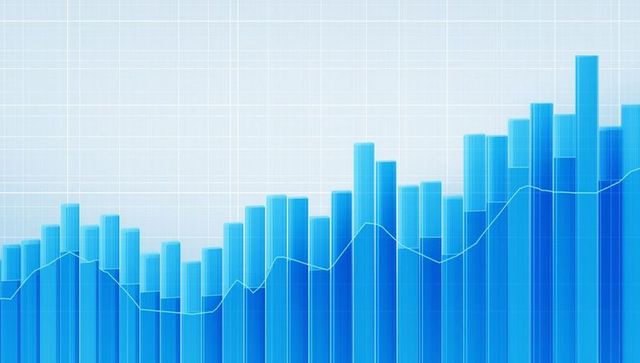
AI Generated Image. Features blue vertical bars rising across screen with intersecting white trend line on a grid, portraying dynamic financial and data analytics. Useful for financial reports, presentations on business growth, educational tools for data interpretation, or general purposes requiring illustrative economic trends and data visualization.
Powered by 


0
downloads
downloads
Tags:
More
Credit Photo
If you would like to credit the Photo, here are some ways you can do so
Text Link
photo Link
<span class="text-link">
<span>
<a target="_blank" href=https://pikwizard.com/photo/blue-bar-chart-with-trend-line-on-grid-background/3fa29c66edbb7156b78ed1af2f7eae19/>PikWizard</a>
</span>
</span>
<span class="image-link">
<span
style="margin: 0 0 20px 0; display: inline-block; vertical-align: middle; width: 100%;"
>
<a
target="_blank"
href="https://pikwizard.com/photo/blue-bar-chart-with-trend-line-on-grid-background/3fa29c66edbb7156b78ed1af2f7eae19/"
style="text-decoration: none; font-size: 10px; margin: 0;"
>
<img src="https://pikwizard.com/pw/medium/3fa29c66edbb7156b78ed1af2f7eae19.jpg" style="margin: 0; width: 100%;" alt="" />
<p style="font-size: 12px; margin: 0;">PikWizard</p>
</a>
</span>
</span>
Free (free of charge)
Free for personal and commercial use.
Author: AI Creator
Similar Free Stock Images
Premium


Premium


Premium


Premium


Premium


Premium


Premium


Premium


Premium


Premium


Premium


Premium


Premium


Premium


Premium


Premium


Premium


Premium


Premium


Premium


Premium


Premium


Premium


Premium