- Home >
- Stock Photos >
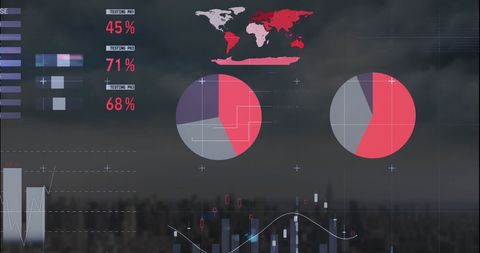
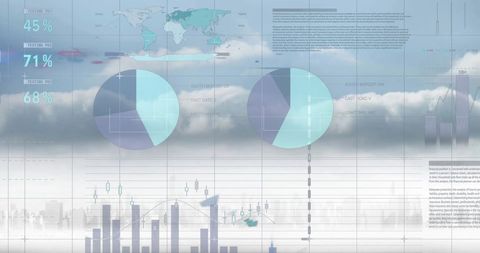
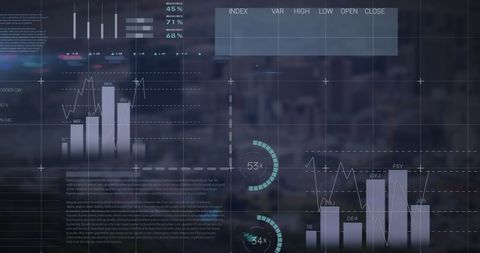
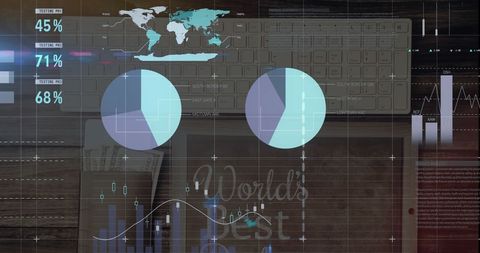
- Blue Digital Interface with Charts and Graphics
Blue Digital Interface with Charts and Graphics Image

Vibrant display featuring various data processing elements over blue background helps convey concept of modern digital technology and analytics. Graphs, charts, and world map suggest a global business context and efficiency in data information transactions, ideal for illustrating themes of big data analysis, business intelligence, and corporate technology within presentations, reports, and educational materials.

downloads
Tags:
More
Credit Photo
If you would like to credit the Photo, here are some ways you can do so
Text Link
photo Link
<span class="text-link">
<span>
<a target="_blank" href=https://pikwizard.com/photo/blue-digital-interface-with-charts-and-graphics/8b0595abf026f6bf166a7f76b786ce05/>PikWizard</a>
</span>
</span>
<span class="image-link">
<span
style="margin: 0 0 20px 0; display: inline-block; vertical-align: middle; width: 100%;"
>
<a
target="_blank"
href="https://pikwizard.com/photo/blue-digital-interface-with-charts-and-graphics/8b0595abf026f6bf166a7f76b786ce05/"
style="text-decoration: none; font-size: 10px; margin: 0;"
>
<img src="https://pikwizard.com/pw/medium/8b0595abf026f6bf166a7f76b786ce05.jpg" style="margin: 0; width: 100%;" alt="" />
<p style="font-size: 12px; margin: 0;">PikWizard</p>
</a>
</span>
</span>
Free (free of charge)
Free for personal and commercial use.
Author: Creative Art