- Home >
- Stock Photos >
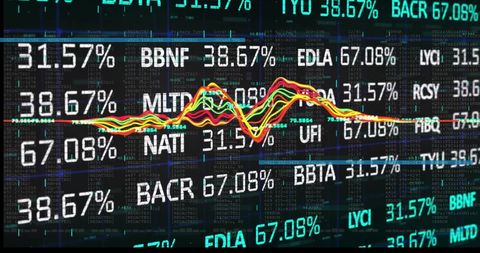
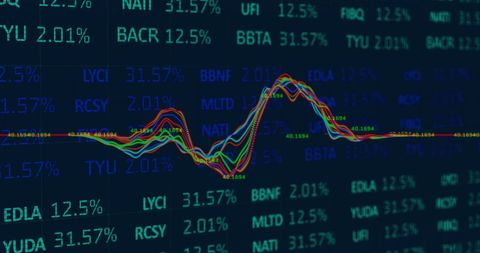
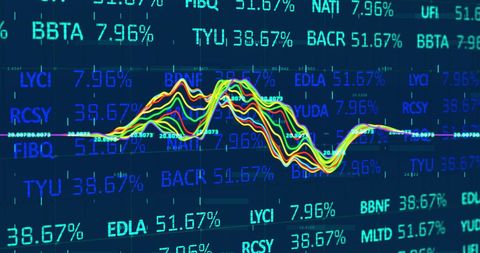
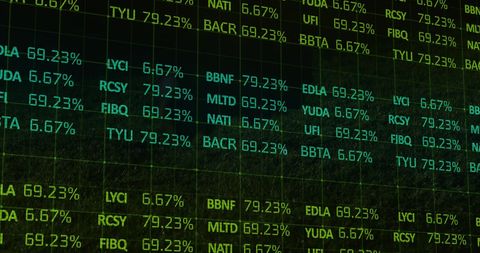
- Blue Graphs Over Stock Market Data on Digital Screen
Blue Graphs Over Stock Market Data on Digital Screen Image

Dynamic digital display featuring overlapping blue financial graphs over stock market data. Essential for illustrating concepts related to global economics, financial technology, stock trading, or analytical reviews. Ideal for financial reports, business presentations, or articles on economic trends and forecasting.

downloads
Tags:
More
Credit Photo
If you would like to credit the Photo, here are some ways you can do so
Text Link
photo Link
<span class="text-link">
<span>
<a target="_blank" href=https://pikwizard.com/photo/blue-graphs-over-stock-market-data-on-digital-screen/d065ebc81b4cdeb4f4e63c6a006dacad/>PikWizard</a>
</span>
</span>
<span class="image-link">
<span
style="margin: 0 0 20px 0; display: inline-block; vertical-align: middle; width: 100%;"
>
<a
target="_blank"
href="https://pikwizard.com/photo/blue-graphs-over-stock-market-data-on-digital-screen/d065ebc81b4cdeb4f4e63c6a006dacad/"
style="text-decoration: none; font-size: 10px; margin: 0;"
>
<img src="https://pikwizard.com/pw/medium/d065ebc81b4cdeb4f4e63c6a006dacad.jpg" style="margin: 0; width: 100%;" alt="" />
<p style="font-size: 12px; margin: 0;">PikWizard</p>
</a>
</span>
</span>
Free (free of charge)
Free for personal and commercial use.
Author: Authentic Images