- Home >
- Stock Photos >
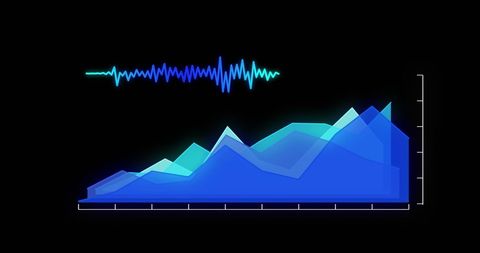
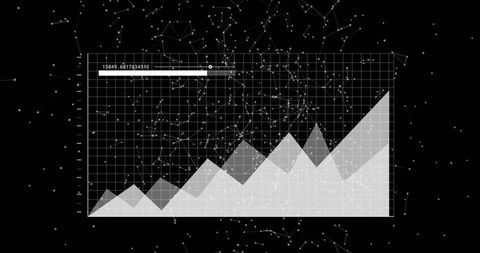
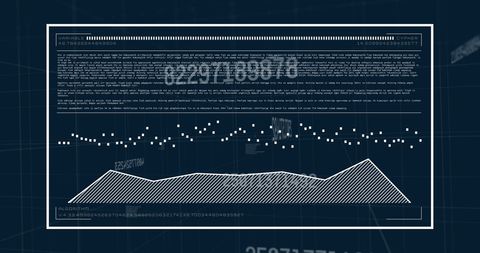
- Blue Statistical Graph Against Abstract Digital Background
Blue Statistical Graph Against Abstract Digital Background Image

Blue-toned statistical graph plotted against a textured black background accented with floating digital particles. Represents themes around business analysis, financial progress, and innovative technology solutions. Ideal for use in presentations, reports, or articles emphasizing data trends or technological growth.

downloads
Tags:
More
Credit Photo
If you would like to credit the Photo, here are some ways you can do so
Text Link
photo Link
<span class="text-link">
<span>
<a target="_blank" href=https://pikwizard.com/photo/blue-statistical-graph-against-abstract-digital-background/edb9287219e0b48a62921536deb44dfb/>PikWizard</a>
</span>
</span>
<span class="image-link">
<span
style="margin: 0 0 20px 0; display: inline-block; vertical-align: middle; width: 100%;"
>
<a
target="_blank"
href="https://pikwizard.com/photo/blue-statistical-graph-against-abstract-digital-background/edb9287219e0b48a62921536deb44dfb/"
style="text-decoration: none; font-size: 10px; margin: 0;"
>
<img src="https://pikwizard.com/pw/medium/edb9287219e0b48a62921536deb44dfb.jpg" style="margin: 0; width: 100%;" alt="" />
<p style="font-size: 12px; margin: 0;">PikWizard</p>
</a>
</span>
</span>
Free (free of charge)
Free for personal and commercial use.
Author: Creative Art