- Home >
- Stock Photos >
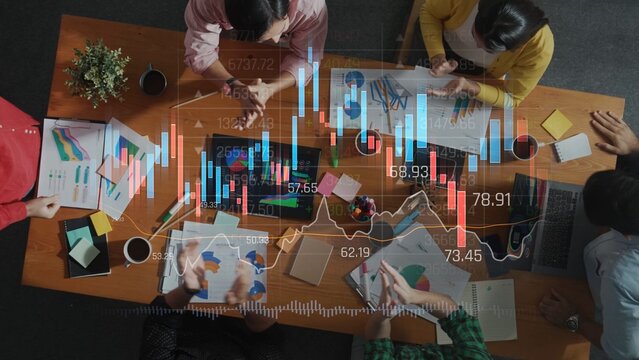
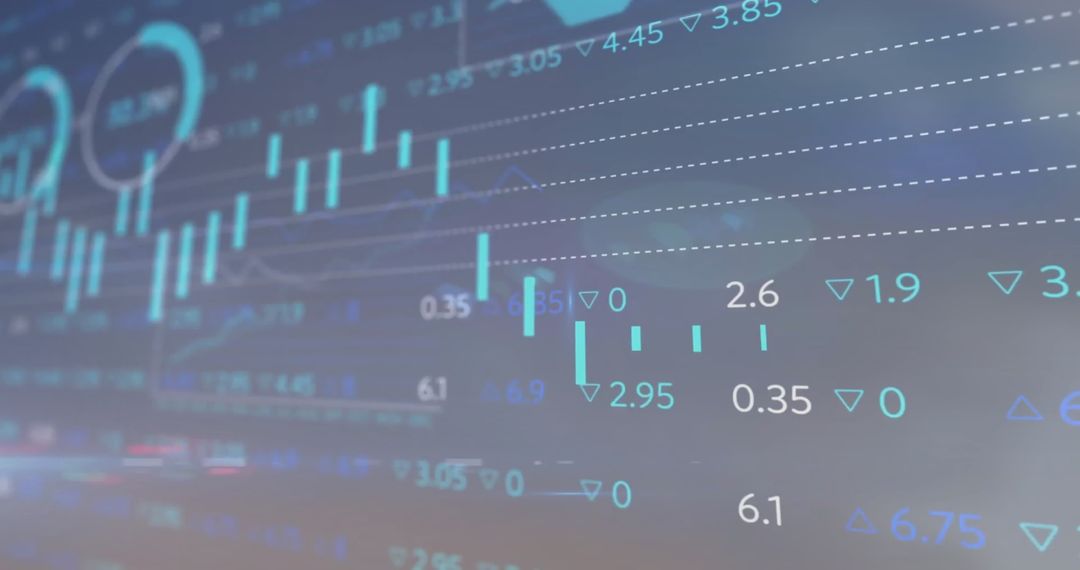
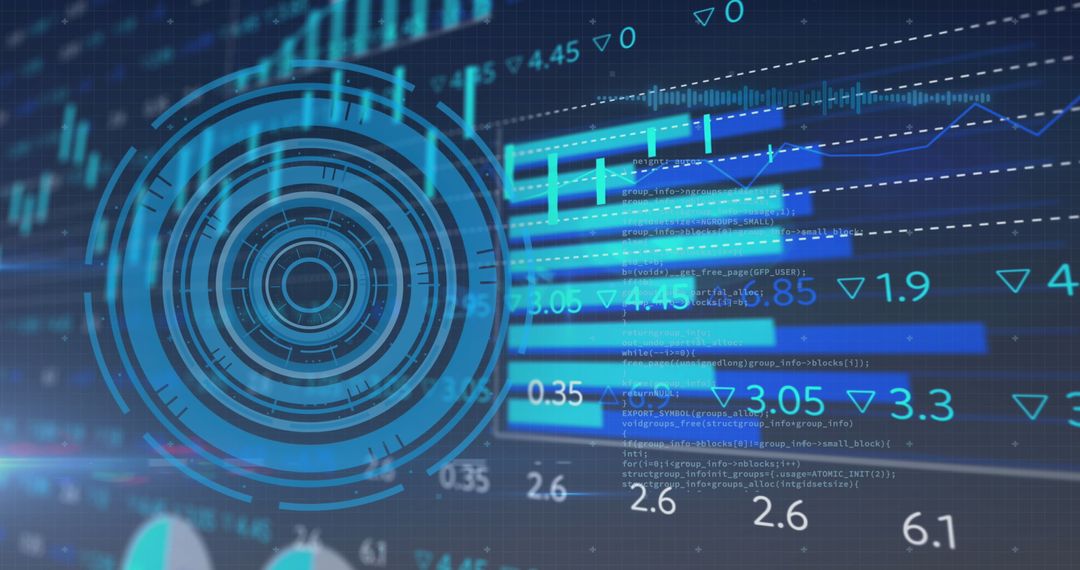
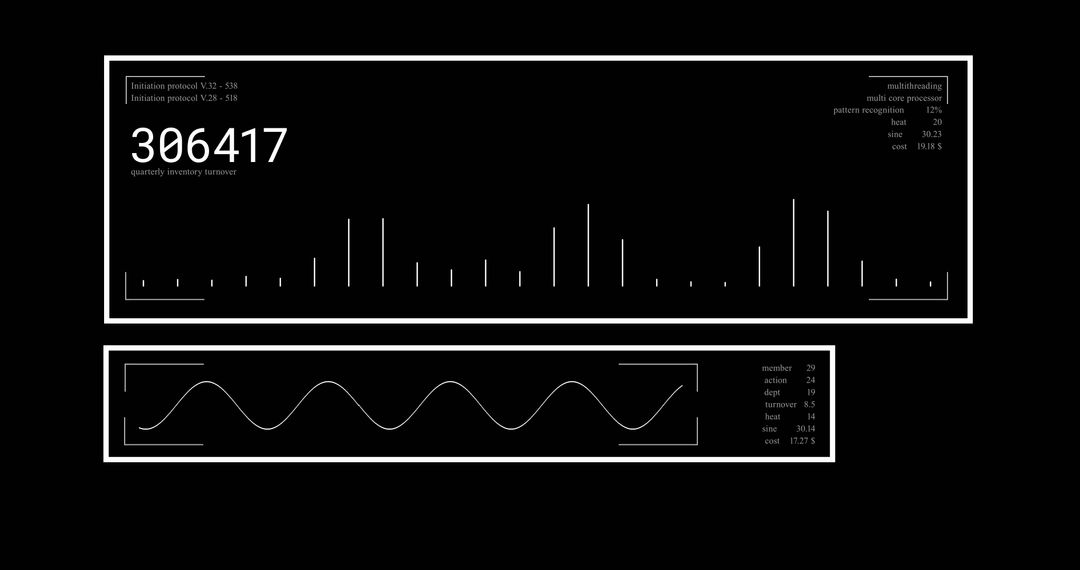
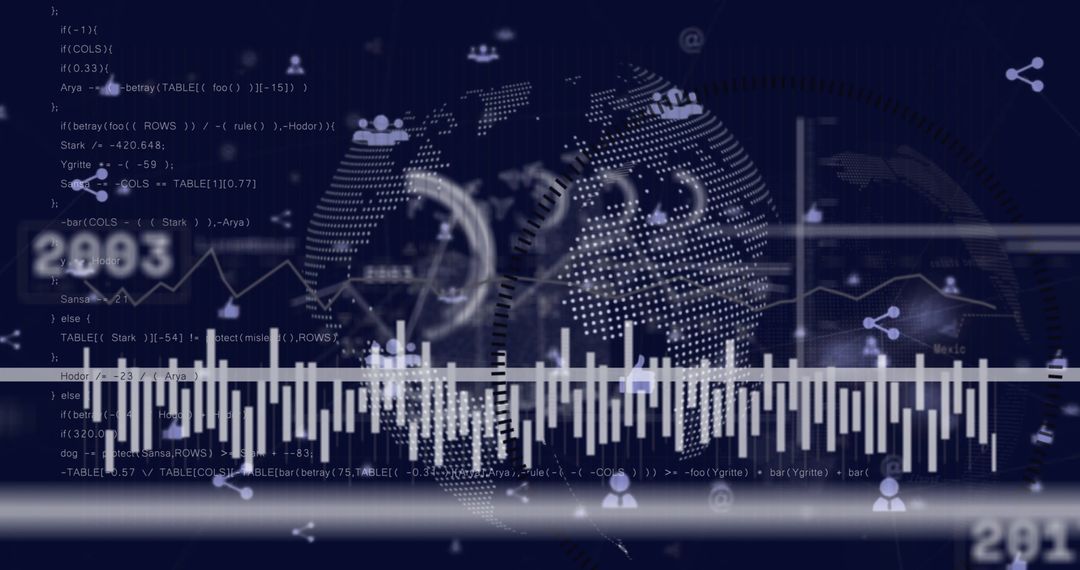
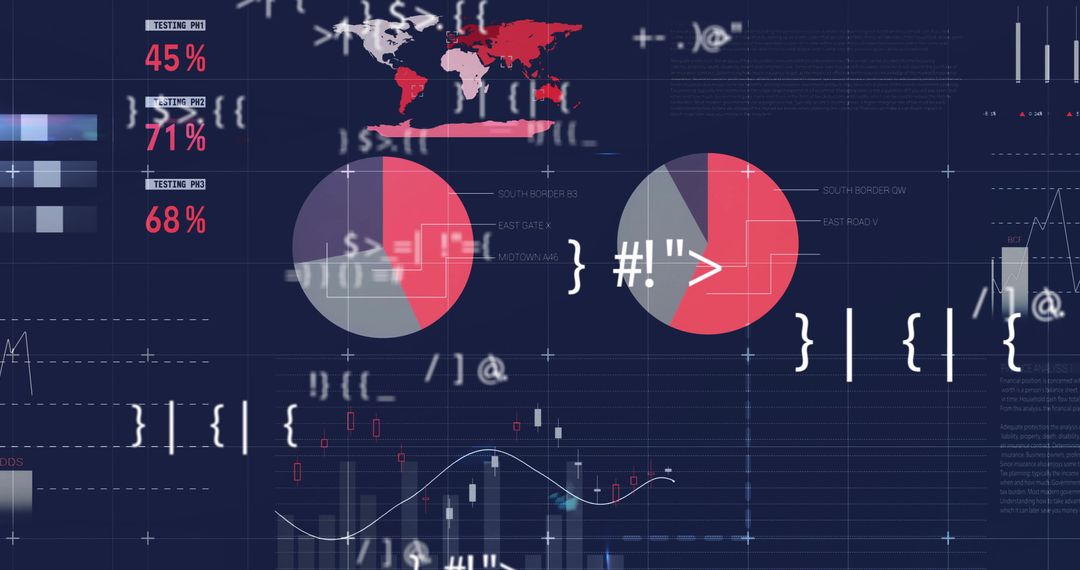
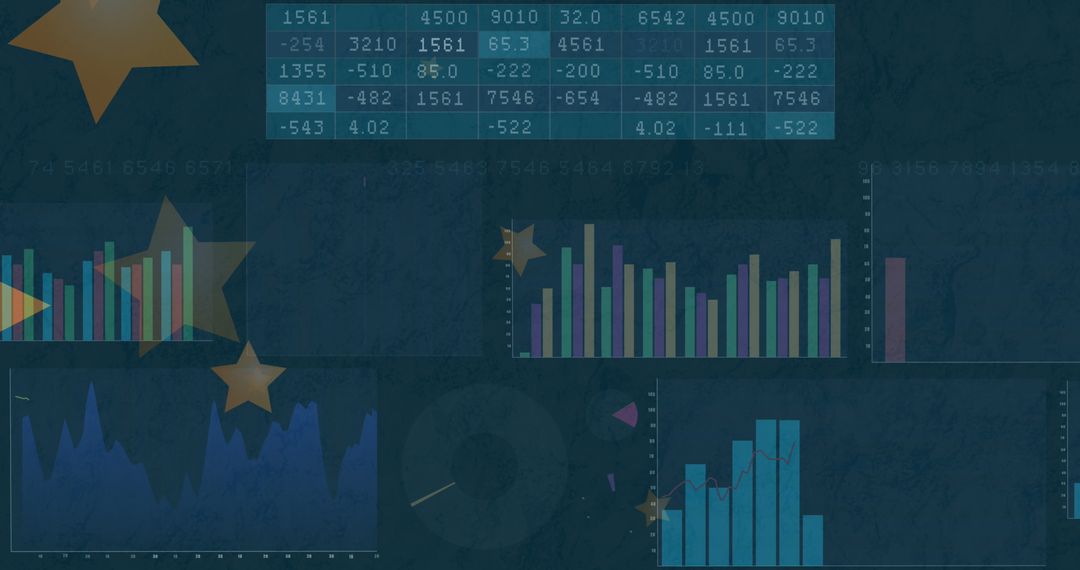
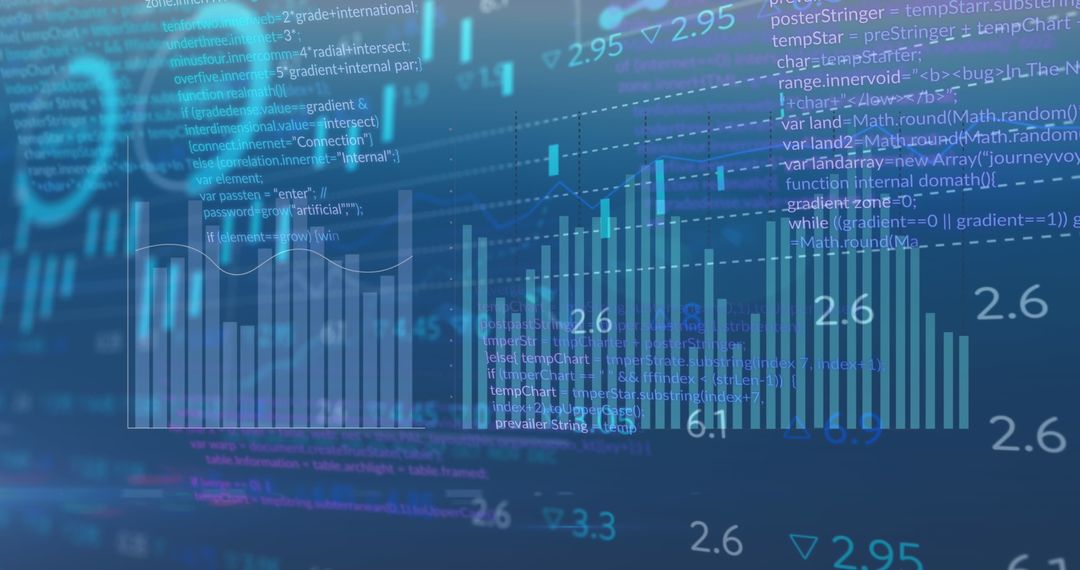
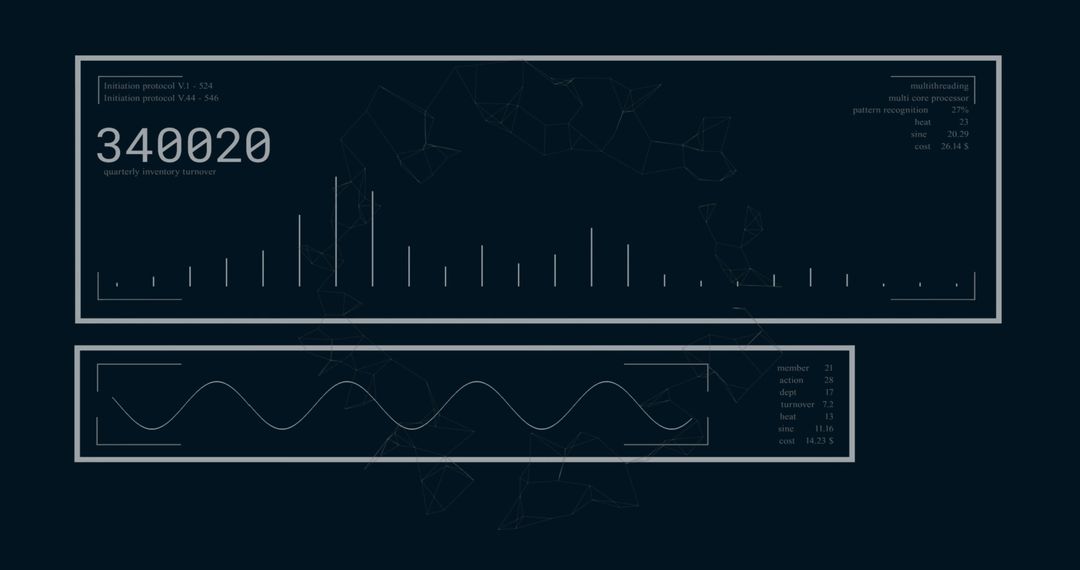
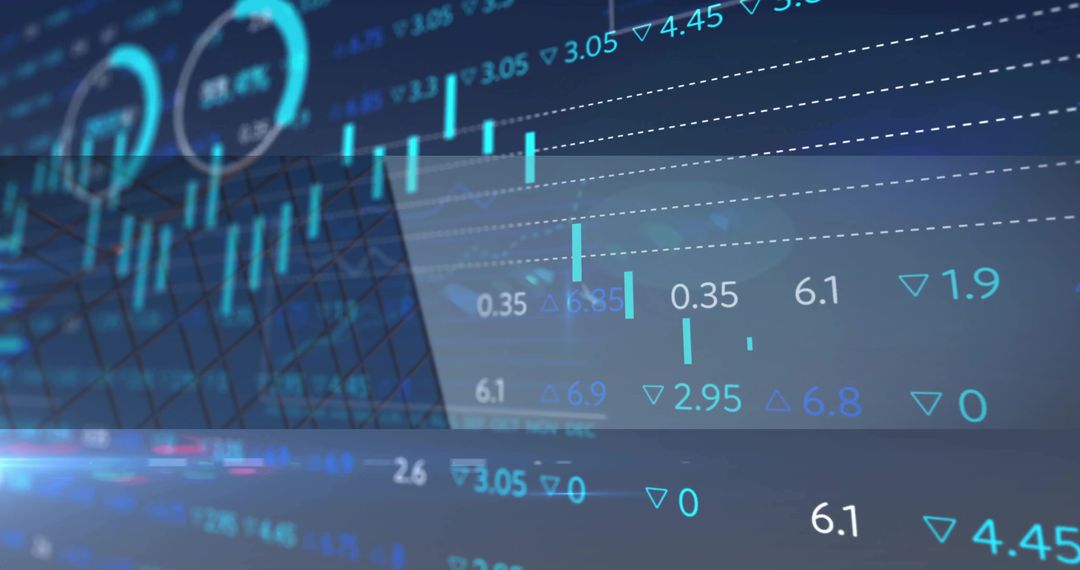
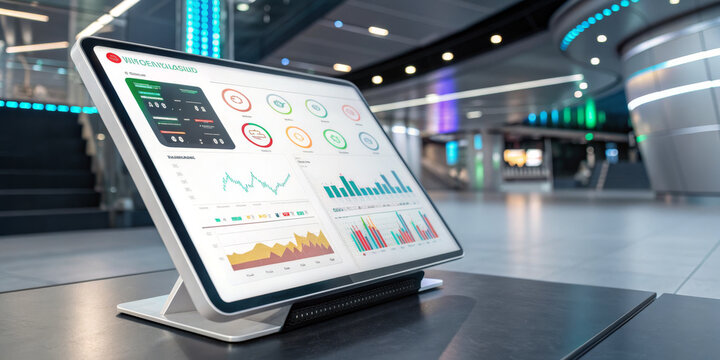
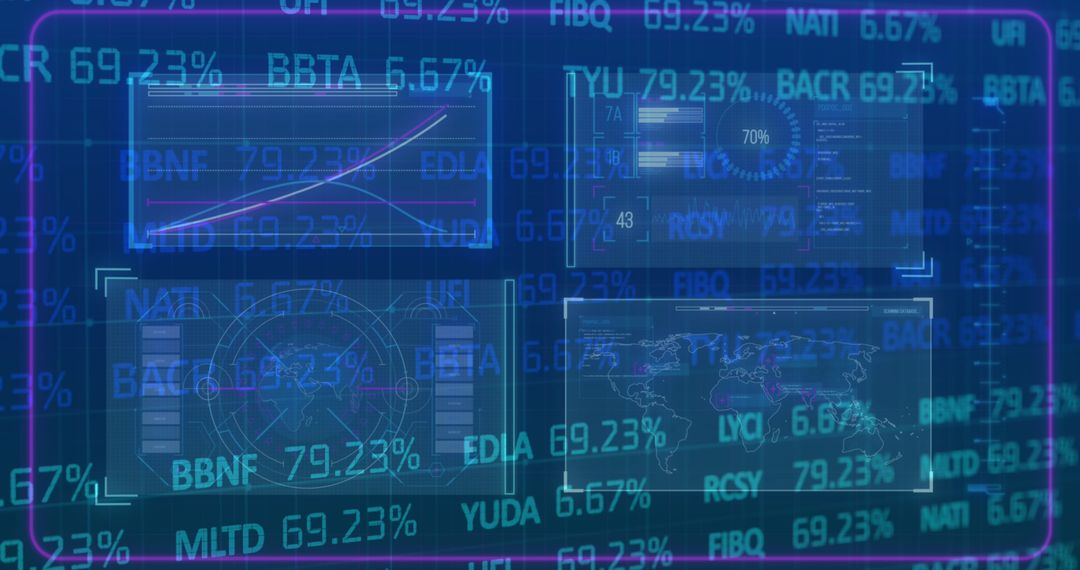
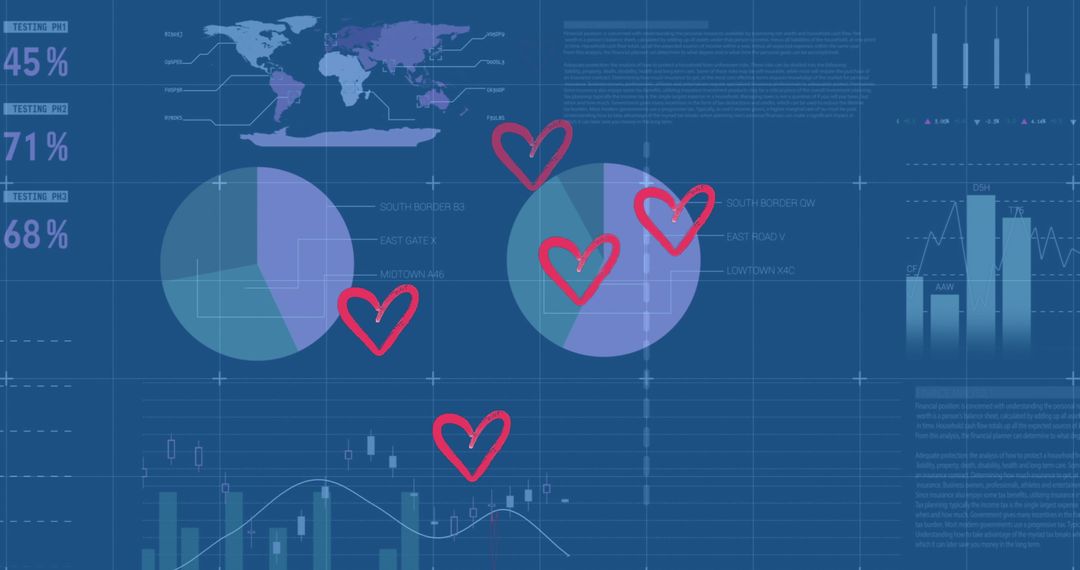
- Blue-teal financial dashboard showing candlestick charts, numeric analytics and gridlines
Blue-teal financial dashboard showing candlestick charts, numeric analytics and gridlines Image

Abstract blue-teal financial dashboard featuring layered candlestick charts, numeric readouts, dashed gridlines and smooth curved overlays. Ideal for financial and fintech projects, helping communicate market movement, trading signals, performance metrics and trend analysis. Using for website headers, app dashboards, investor presentations, pitch decks, marketing banners, social media posts, editorial layouts, annual reports and training materials. Customizing by overlaying logos, adding concise text, adjusting color palette or combining with icons and live data widgets. Maintaining modern, data-driven aesthetic suitable for corporate branding, fintech UX, trading platform demos and educational content.
Powered by 


0
downloads
downloads
Tags:
More
Credit Photo
If you would like to credit the Photo, here are some ways you can do so
Text Link
photo Link
<span class="text-link">
<span>
<a target="_blank" href=https://pikwizard.com/photo/blue-teal-financial-dashboard-showing-candlestick-charts-numeric-analytics-and-gridlines/98dd33ce53f645624801c357e7854057/>PikWizard</a>
</span>
</span>
<span class="image-link">
<span
style="margin: 0 0 20px 0; display: inline-block; vertical-align: middle; width: 100%;"
>
<a
target="_blank"
href="https://pikwizard.com/photo/blue-teal-financial-dashboard-showing-candlestick-charts-numeric-analytics-and-gridlines/98dd33ce53f645624801c357e7854057/"
style="text-decoration: none; font-size: 10px; margin: 0;"
>
<img src="https://pikwizard.com/pw/medium/98dd33ce53f645624801c357e7854057.jpg" style="margin: 0; width: 100%;" alt="" />
<p style="font-size: 12px; margin: 0;">PikWizard</p>
</a>
</span>
</span>
Free (free of charge)
Free for personal and commercial use.
Author: People Creations
Similar Free Stock Images
Premium


Premium


Premium


Premium


Premium


Premium


Premium


Premium


Premium


Premium


Premium


Premium


Premium


Premium


Premium


Premium


Premium


Premium


Premium


Premium


Premium


Premium


Premium


Premium