- Home >
- Stock Photos >
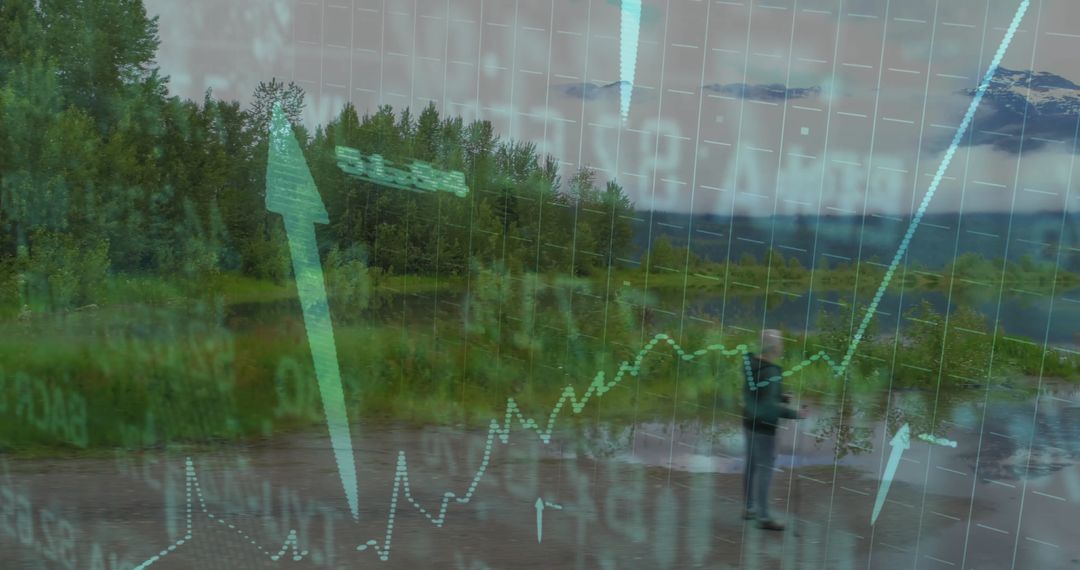
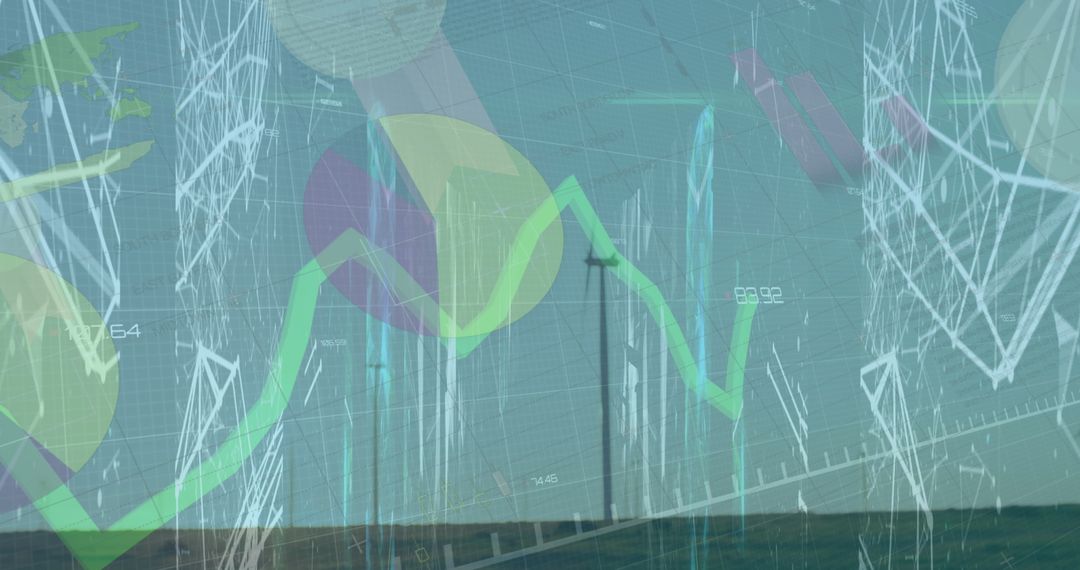
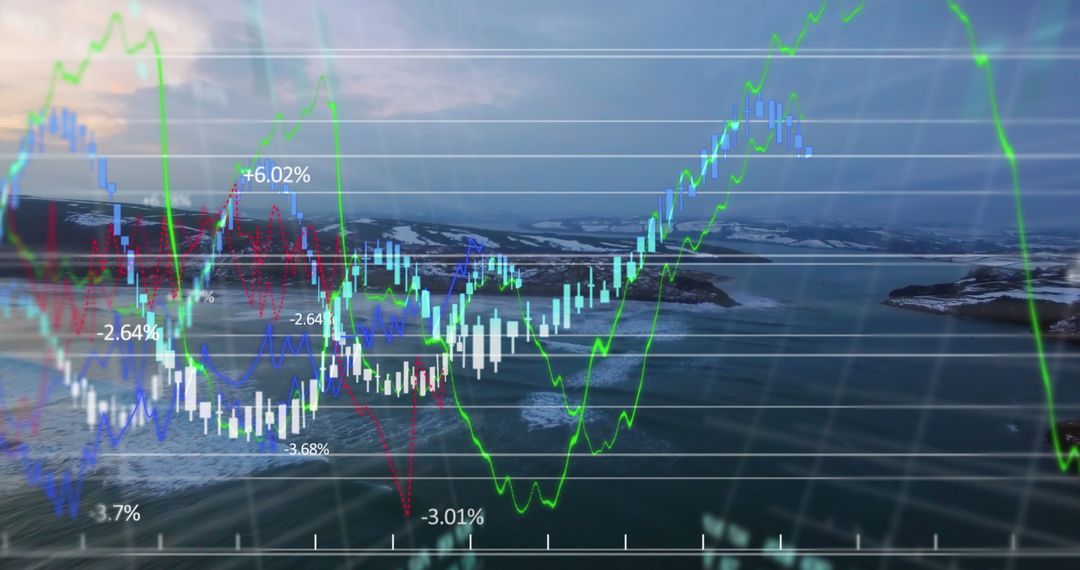
- Bright Green Financial Graph over Serene Lake at Dusk
Bright Green Financial Graph over Serene Lake at Dusk Image

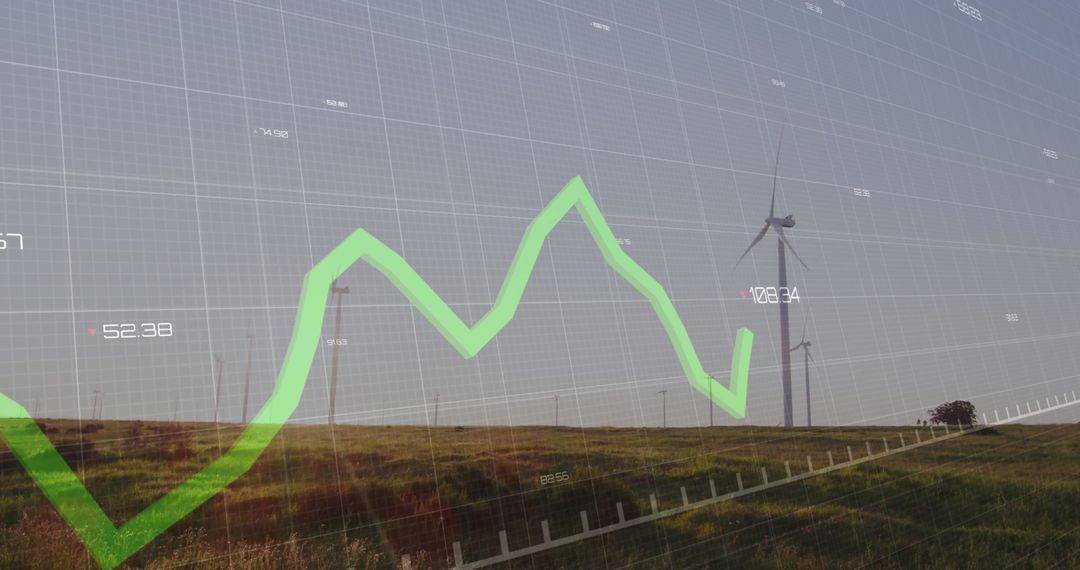
The serene backdrop combined with digital elements signifies harmony between nature and technology. This visualization is useful for presentations on sustainable business practices, financial data analysis, or digital economy marketing projects. It appeals to audiences interested in tech advancement within natural contexts, suitable for conveying growth trends and analytics impactfully.
Powered by  - Get 15% off with code: PIKWIZARD15


0
downloads
downloads
Tags:
More
Credit Photo
If you would like to credit the Photo, here are some ways you can do so
Text Link
photo Link
<span class="text-link">
<span>
<a target="_blank" href=https://pikwizard.com/photo/bright-green-financial-graph-over-serene-lake-at-dusk/2d387b531076518fba2f945b1a0a233f/>PikWizard</a>
</span>
</span>
<span class="image-link">
<span
style="margin: 0 0 20px 0; display: inline-block; vertical-align: middle; width: 100%;"
>
<a
target="_blank"
href="https://pikwizard.com/photo/bright-green-financial-graph-over-serene-lake-at-dusk/2d387b531076518fba2f945b1a0a233f/"
style="text-decoration: none; font-size: 10px; margin: 0;"
>
<img src="https://pikwizard.com/pw/medium/2d387b531076518fba2f945b1a0a233f.jpg" style="margin: 0; width: 100%;" alt="" />
<p style="font-size: 12px; margin: 0;">PikWizard</p>
</a>
</span>
</span>
Free (free of charge)
Free for personal and commercial use.
Author: Awesome Content
Similar Free Stock Images

Premium


Premium


Premium


Premium


Premium


Premium


Premium


Premium


Premium


Premium


Premium


Premium


Premium


Premium


Premium


Premium


Premium


Premium


Premium


Premium


Premium


Premium


Premium


Premium