1. Home > 
  2. Stock Photos > 
  3. Bright Green Sales Statistics on Futuristic Grid Display

Bright Green Sales Statistics on Futuristic Grid Display Image

Bright Green Sales Statistics on Futuristic Grid Display

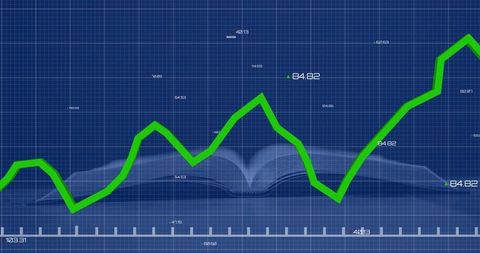
This energetic illustration of a green statistic line on a digital display conveys the dynamic nature of sales data and market analysis. Perfect for presentations, reports, or articles about business trends and technology, the image highlights themes of growth, volatility, and comprehensive data processing. The futuristic elements make it suitable for content related to innovation and digital transformation in business settings.

Powered by Adobe logo
Bright red capsules are scattered on a surface, with a transparent cup holding a few. A red upward arrow graph illustrates growth trends in the pharmaceutical industry. - Powered by AdobeColorful bar graph showing growth on a vibrant pink background - Powered by AdobeMiniature Cars on a Financial Chart Illustrating Market Trends and Business Concepts in an Artistic Top-Down Perspective - Powered by AdobeFingertip touches the peak of a glowing blue bar graph indicating financial growth and success - Powered by AdobeA person in a suit holds a red zigzag arrow pointing downward, symbolizing financial decline or business loss. - Powered by Adobe

Credit Photo

If you would like to credit the Photo, here are some ways you can do so

Free (free of charge)

Free for personal and commercial use.

Author: Awesome Content

Similar Free Stock Images

Loading...
Dynamic Financial Graphs with Statistical Data on Blue Grid
Premium
Digital sales performance dashboard showing sales performance metrics, performance trends, sales performance analytics, and sales improvement in business context. Muxer
Data Analysis Process with Green Digital Interface
Premium
business graph with arrow graph business chart arrow growth market finance success diagram stock
Premium
Bar graph showing Cyber Monday revenue growth sales
Digital Financial Analysis with Infographic and Data Flow
Dynamic Stock Market Data with Fluctuating Graph
Digital Data Analysis with Green Line Graph on Grid Background
Premium
Hospital, meeting and people on laptop with documents for finance report, budget and funding. Healthcare, team and workers with graph, statistics and paperwork for insurance, medical grant or revenue
Declining Financial Market Chart Over Grid Background
Green Financial Line Chart Over Modern Office Buildings
Digital DNA and Data Analytics Fusion Visualization
Digital Lock with Real-Time Data Display
Rising Graph Line on Digital Green Grid Background
Green Data Graph on Black Digital Interface
Financial Growth Chart with Dynamic Green Line on Grid Overlay
Futuristic Financial Data Visualization with Graph
Premium
Manager touches growth graph on analytics dashboard. Business data analysis reports with marketing finance management strategy. Digital charts graphs increase business performance, sales statistic
Economic Downturn in Festive Context with Easter Eggs
Sharp Decline in Stock Market Graph Against Red Financial Data Background
Green Line Graph with Data Points on Grid Background
Financial Data Analysis with Digital Graph Overlay
Premium
A line graph showing real-time stock price trends floating above a hand on a blurred grey background
Financial Data Visualization with Global Network Elements
Fluctuating Financial Graph on Digital Orange Background
Dynamic Financial Stock Market Analysis Display
Global Financial Data and Social Media Escalation Chart
Premium
Wooden blocks forming a rising graph with a target and arrow at the top
Futuristic Data Dashboard Showing Dynamic Red Line Graph
Fluctuating Financial Data with Graph Overlay
Dynamic Data Visualization with Fluctuating Trendline and Indicators
Dynamic Graphs Depicting Financial Trends on Purple Grid Background
Dynamic Financial Data with Red Line on Digital Interface
Digital Data Processing Interface with Code and Graph
Digital Currency Trading Interface with Data Visualization
Financial Graph and Cityscape Analysis with Technological Overlay
Fluctuating Financial Graph With Data Visualization
Premium
Financial analysis concept featuring a magnifying glass over business charts demonstrating growth and increasing profits visualization.
Digital Grid Interface with Data Points for Business Analysis
Financial Growth Trends Over Cityscape Background
Dynamic Green Line Graph Showing Financial Data Fluctuations
Rising Green Line Chart Overlays Concept of Financial Growth
Abstract Digital Chart with Cyber Grid Background
Premium
Growing sales graph with upward red arrow and the word sales in 3d letters
Premium
A close-up view of stacked coins with a rising graph in the background, symbolizing financial growth and investment strategy in the business world.
Digital Data Processing Interface with Green Growth Chart
Financial Data Analysis with Trend Line and Statistics
Digital Hologram with Dynamic Numbers on Graph Grid
Binary Code Financial Analytics with Rising Graph Line
Premium
Blue 3d bar graph with upward arrow isolated on transparent background
Digital Stock Market Graph with Abstract Coding Background
Green Graph Showing Forex Trends on Transparent Cyber Interface
Dynamic Financial Data on Dark Background With Colorful Graphs
Digital Interface with Overlapping Code and Graph
Premium
Upward trend financial graph showing business growth. A green arrow on a transparent bar chart represents statistics and success on a dark background.
Analyzing Growing Graph Line on Purple Gradient Background
Digital Decline Graphic with QR Code Elements and Red Line
Financial Chart with Dynamic Data on Black Grid
Digital Financial Chart with Green Trend Line on Grid Background
Premium
A chalkboard displaying a rising sales graph with an upward arrow, next to a cup of coffee on a wooden table.
Red Zigzag Graph on Digital Analytics Dashboard Interface
Blueprint Analysis with Green Line Graph on Open Book
Dynamic Stock Market Graphs with Trends and Data Alerts
Dynamic Financial Graph with Changeable Metrics Over Green Line
Premium
Businessman analyzing financial charts and graphs with a pen while working on reports and calculations at the office.
Financial Data Chart Over City Silhouette
Red Line Graph Over Histogram Representing Financial Volatility
Global Financial Data and Graph Analysis Technology
Economic Trends Analysis with Financial Indicators and Graphs
Premium
3D bar chart with a prominent green arrow showing upward trend. Ideal for concepts of business growth, financial success, positive progress, and increasing profits
Cryptocurrency Growth Chart Over Digital World Map
Premium
A blue bar graph with an arrow pointing upwards indicating growth on a black background in a studio shot created with generated ai
Green Line Chart with Financial Data on Digital Display
Digital Financial Data and Global Market Analysis on Graph
Data Analysis and Cybersecurity Concept Art
Abstract Graph with Social Media Notification Icons and Data Points
Premium
Magnifying glass highlights business growth chart with upward trend. Generative AI analysis financial success stock increase profit investment statistic performance market economy improvement
Premium
Financial data chart overlay with clothing store interior in the background. Perfect for retail analytics, fashion business insights, and sales performance visualization.
Binary Code and Financial Data on Digital Screen
Digital Data Analytics with Financial Graphs and Indigo Background
Dynamic Financial Chart with Red Line Graph on Digital Interface
Dynamic Red Line Graph With Data Points on Gridded Background
Futuristic Data Trend Graphs on Digital Interface
Green Line Chart Overlay on Dark Financial Data Background
Global Financial Data and Stock Market Trends on World Map
Financial Data Analysis with Declining Trend on Blueprint Graph
Premium
Management data System KPI connected in database for follow earnings,operations and sales data. Businessman using KPI dashboard.Financial business data analytics graph dashboard.
Digital Data Analysis on Blue Grid Background with Graphs
Dynamic Green Financial Graph with Business Icons
Eye Chart with Digital Data Integration Visualizing Business Trends
Colorful Financial Data Charts on Digital Grid Background
Premium
Red line graph showing upward trend with sharp increases and a leftward arrow
Premium
Young Black man in a grey suit presenting quarterly sales growth data to colleagues, pointing at a digital graph on a projector screen, modern office setting
Rising Stock Market Trends and Chart Analysis
Financial Market Decline on Digital Screen With Red Line Graph
Digital Interface with Data Processing Visualization
Cityscape Enhances Financial Data Visualization Digital Concept
Dynamic Financial Data Visualization over Urban Silhouette
Declining Graph with 49% Reduction on Dark Digital Background
Digital Data Visualization on Grid Display
Dynamic Stock Market Data Display in Red and Green Ticker
Futuristic Graph and Data Visualization Interface Design
Digital Data Analysis with Security Threat Warning
Green Financial Line Graph with Candlestick Data on Grid Background
Premium
Business Growth and Success Concept with Rising Graph. hand drawing graph Background
Global Data Exchange Network
Abstract Digital Data with Upward Trending Line Graph
Digital Interface Displaying Volatile Financial Market Analysis
Dynamic Financial Data Representation on Digital Grid
Futuristic Data Processing Interface with Dynamic Graphs
Declining Stock Market Graph with Red Trend Line
Digital Financial Interface Over Cityscape
Dynamic Red Line Graph on Digital Data Grid Background
Premium
3D Rendered Blue Bar Chart Showing Growth with a Curved Upward Arrow on a White Background
Premium
Analyst reviewing declining sales graph on laptop
Digital Stock Market Data and Trends Visualization
Fluctuating Financial Graph on Green Grid Background
Digital Data Visualization with Graphs on Gradient Background
Green Line Graph on Dark Digital Grid
Premium
A red line graph shows an upward sales trend on a transparent panel in a busy office filled with workers
Digital Green Line Graph Over Grid with Statistics and Numbers
Digital Financial Chart and Global Currency Symbols on Blue Background
Dynamic Line Graph Displaying Data Trends on Beige Grid Background
Fluctuating Line Graph on Analytics Dashboard
Red Line Chart Trending Downward in Data Visualization