- Home >
- Stock Photos >
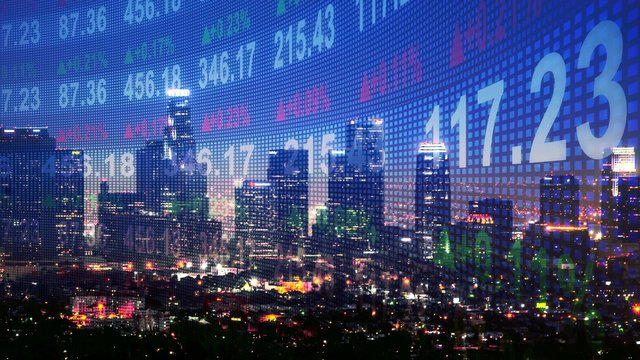
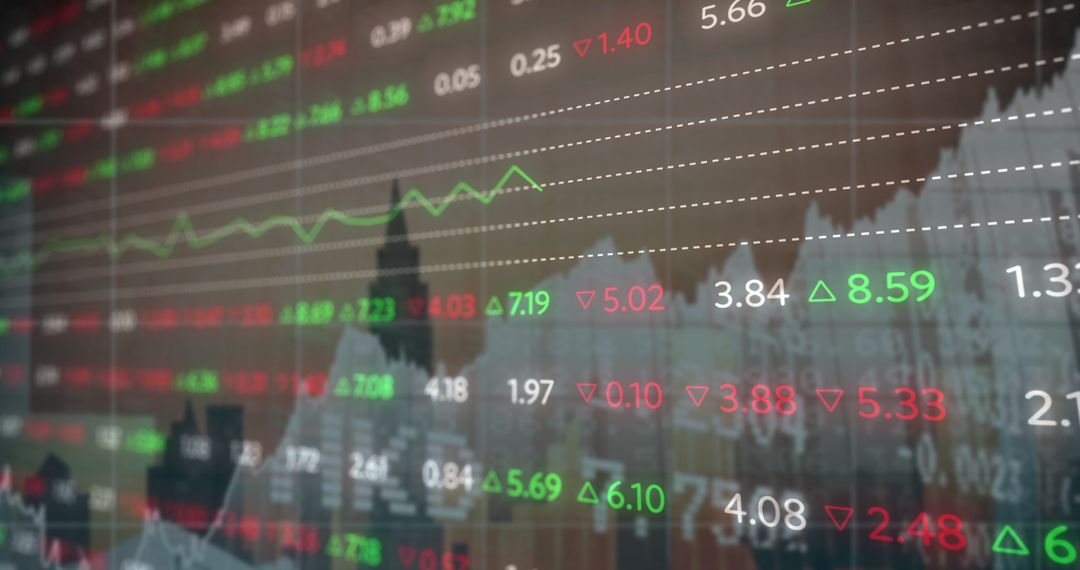
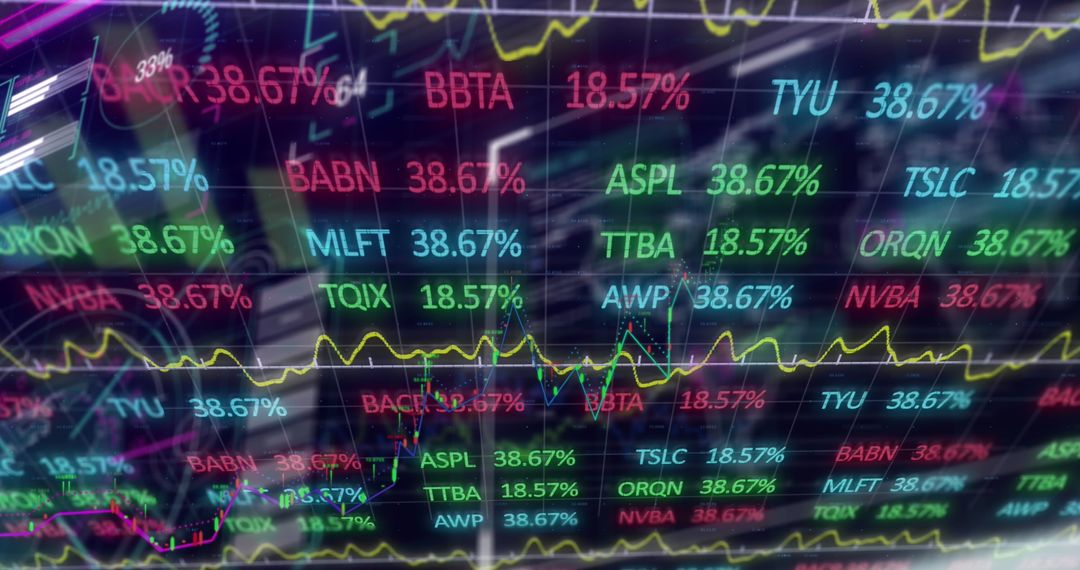
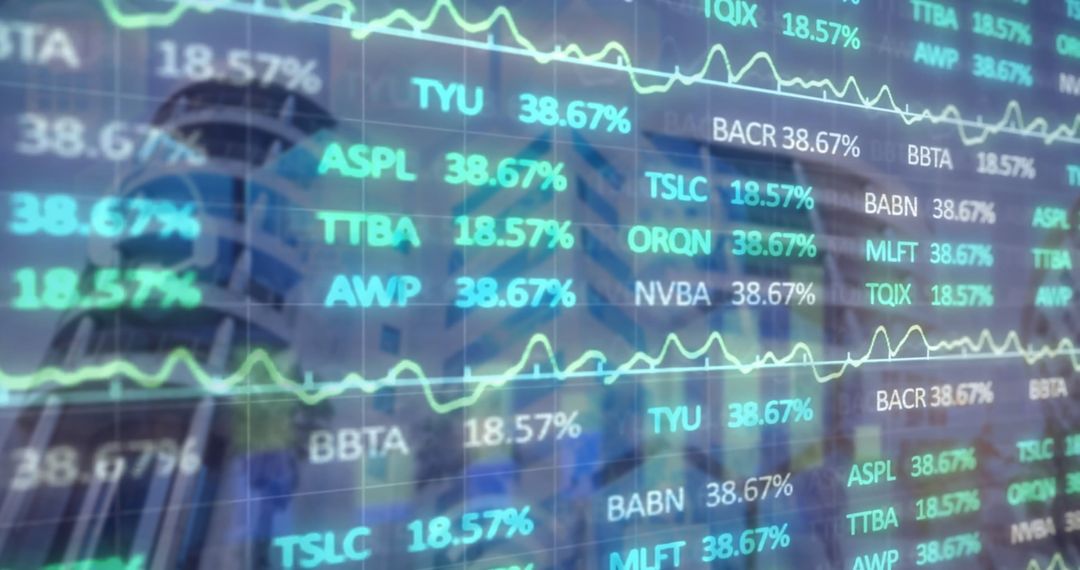
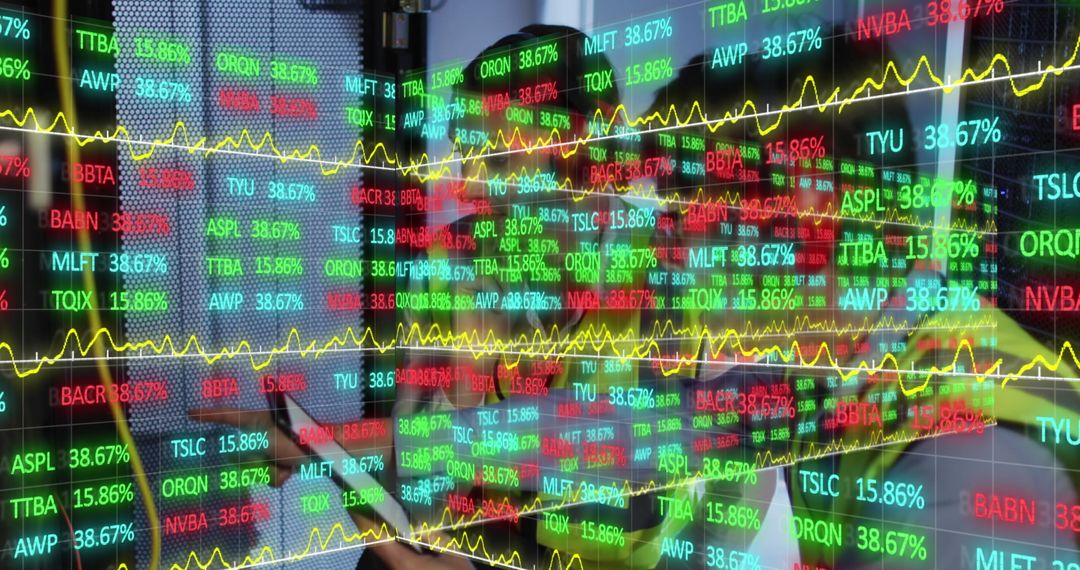
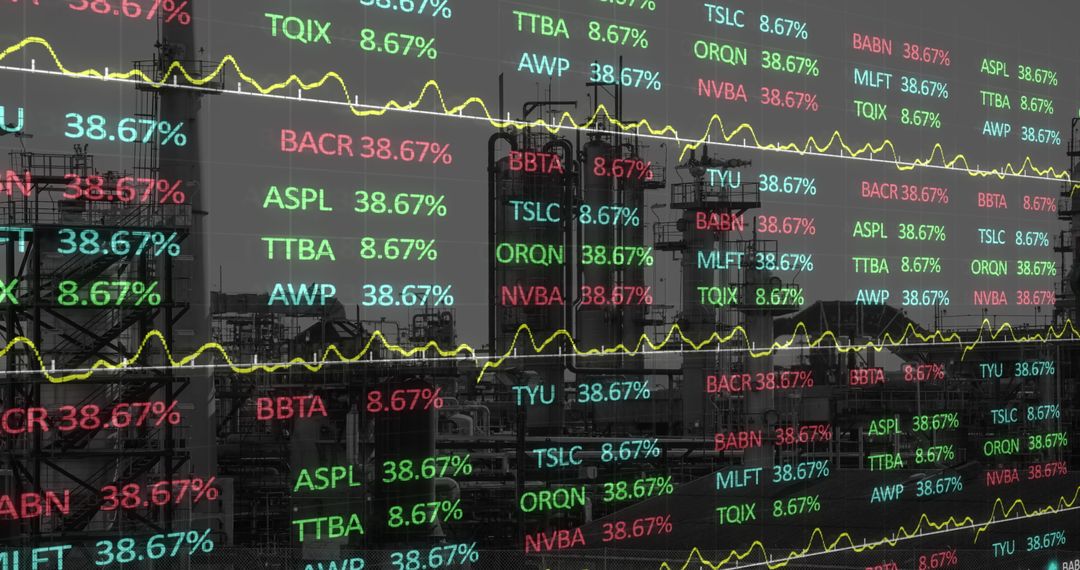
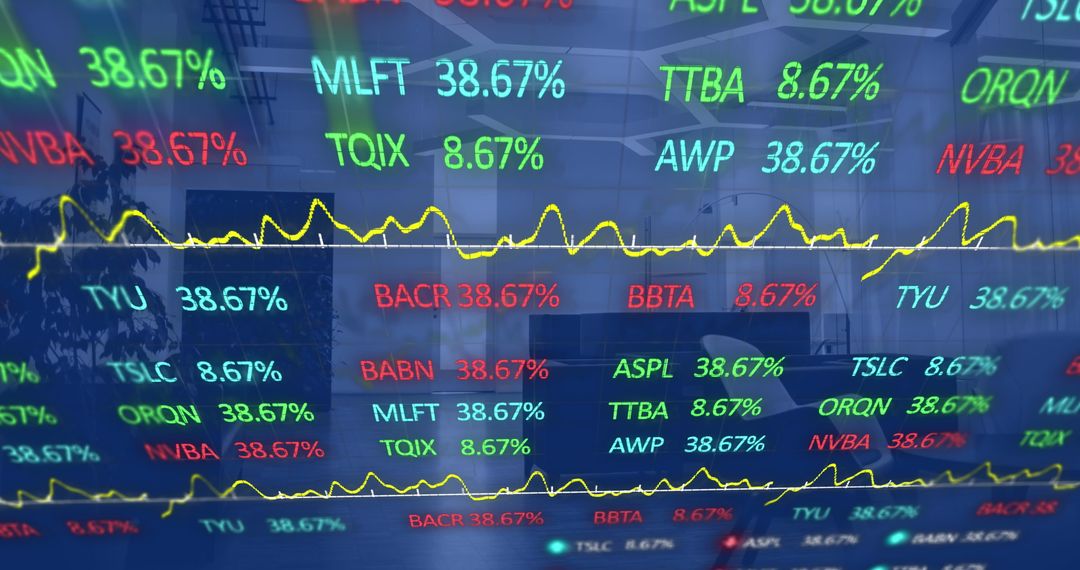
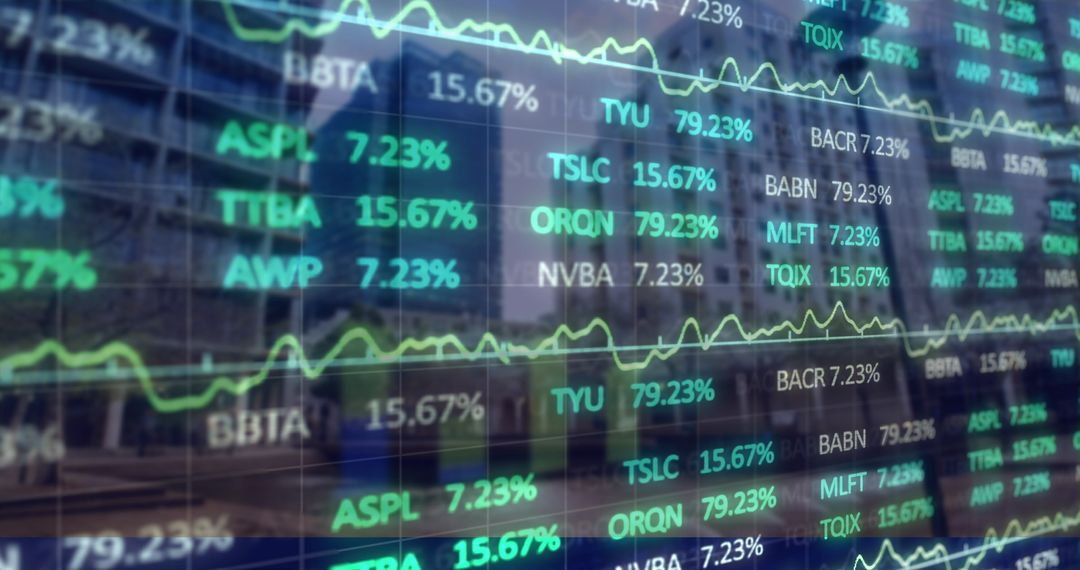
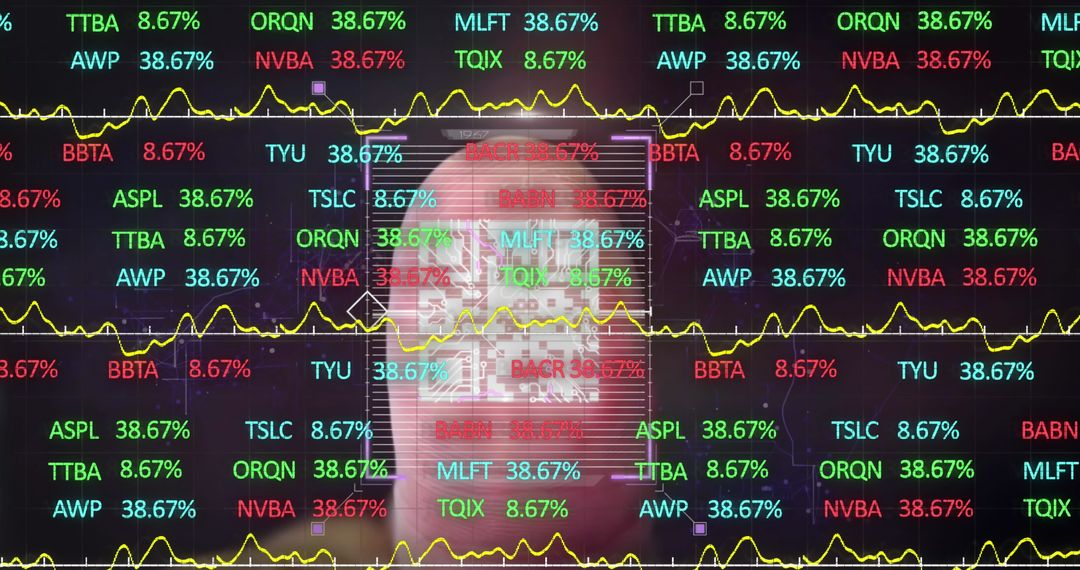
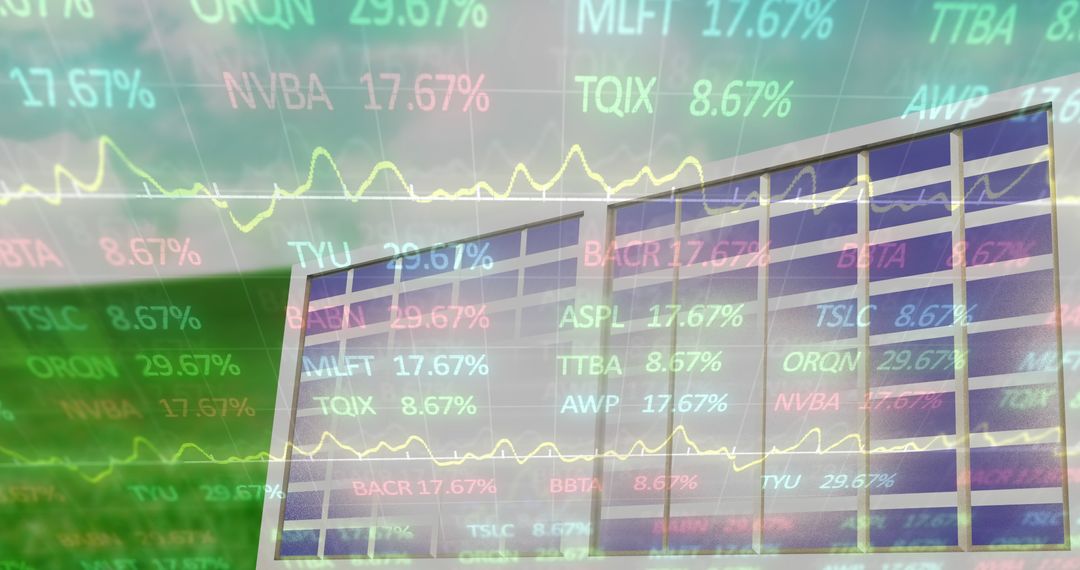
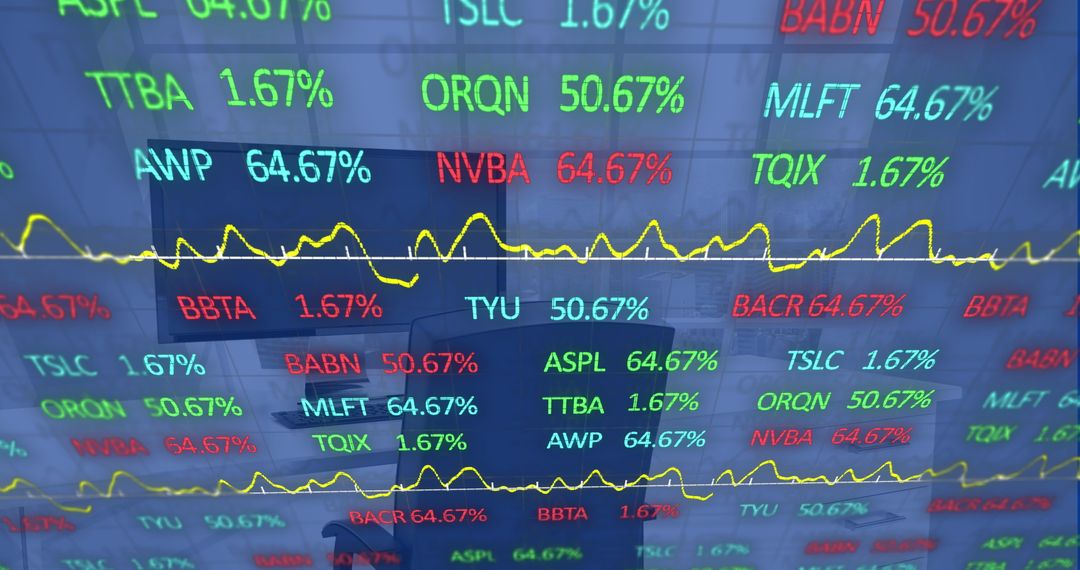
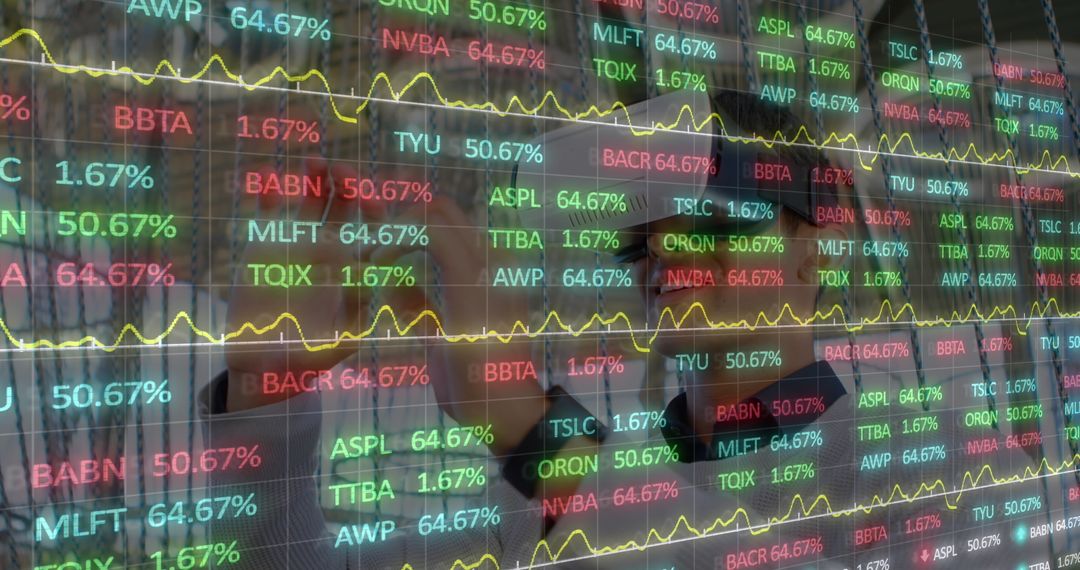
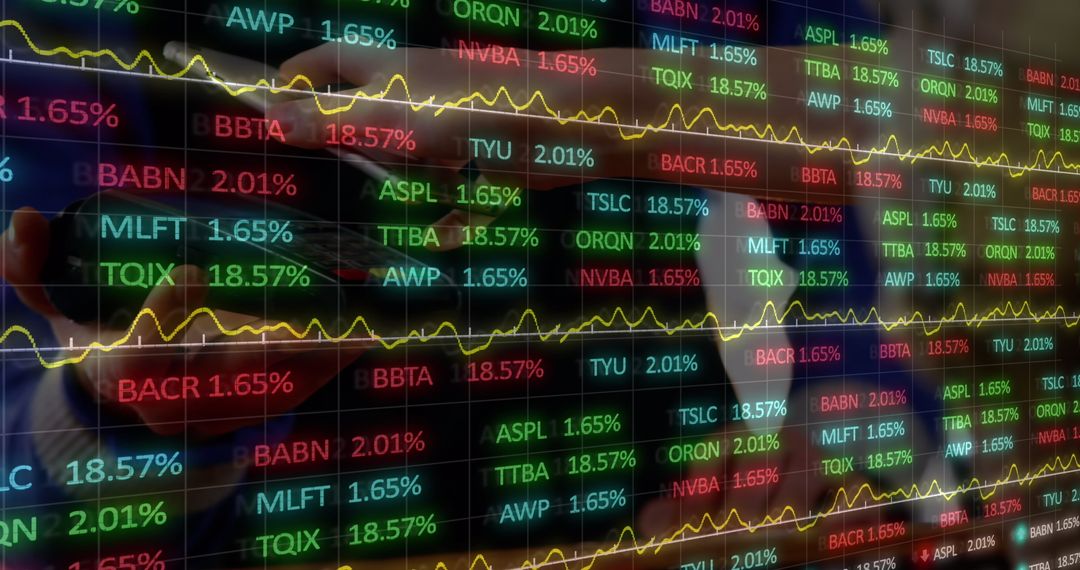
- Broker Analyzing Real-time Stock Market Data on Multiple and Oversized Screens
Broker Analyzing Real-time Stock Market Data on Multiple and Oversized Screens Image

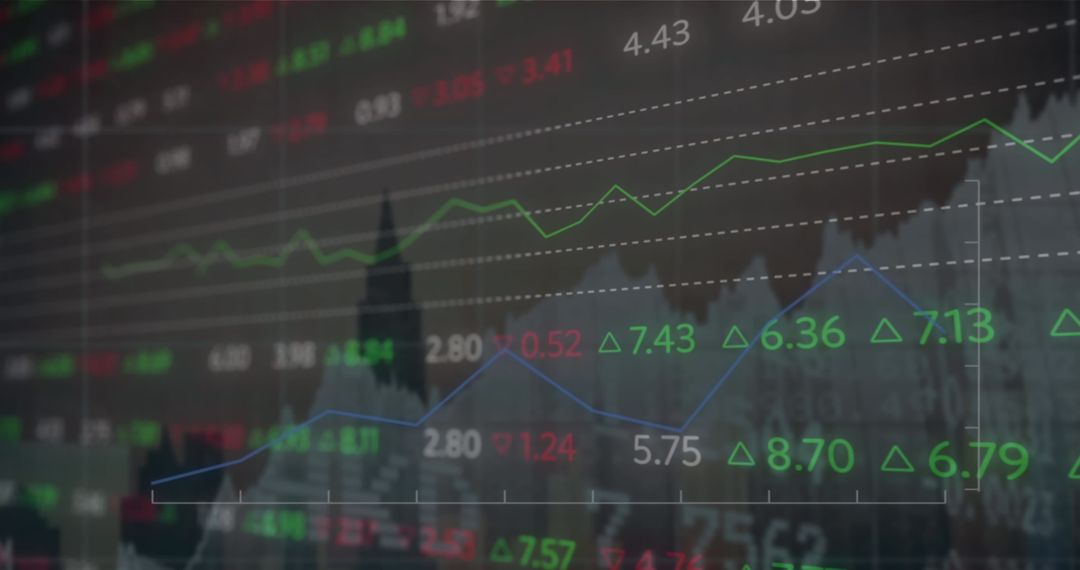
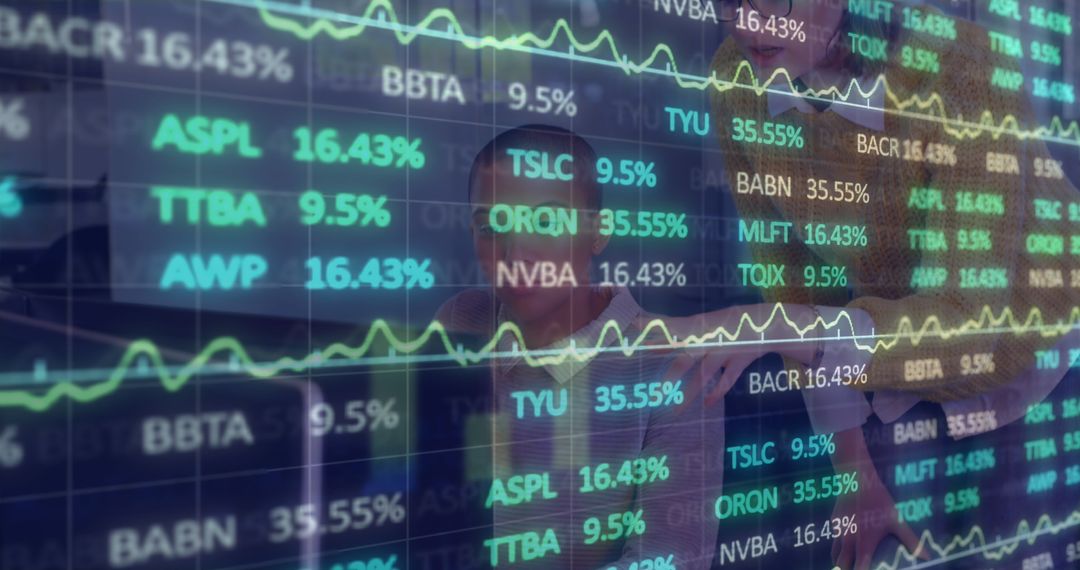
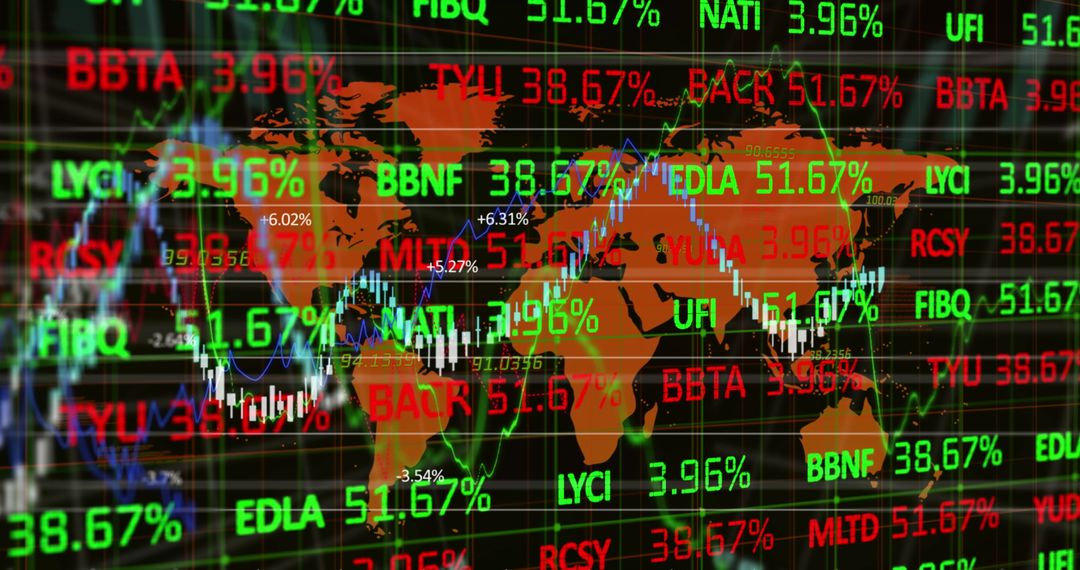
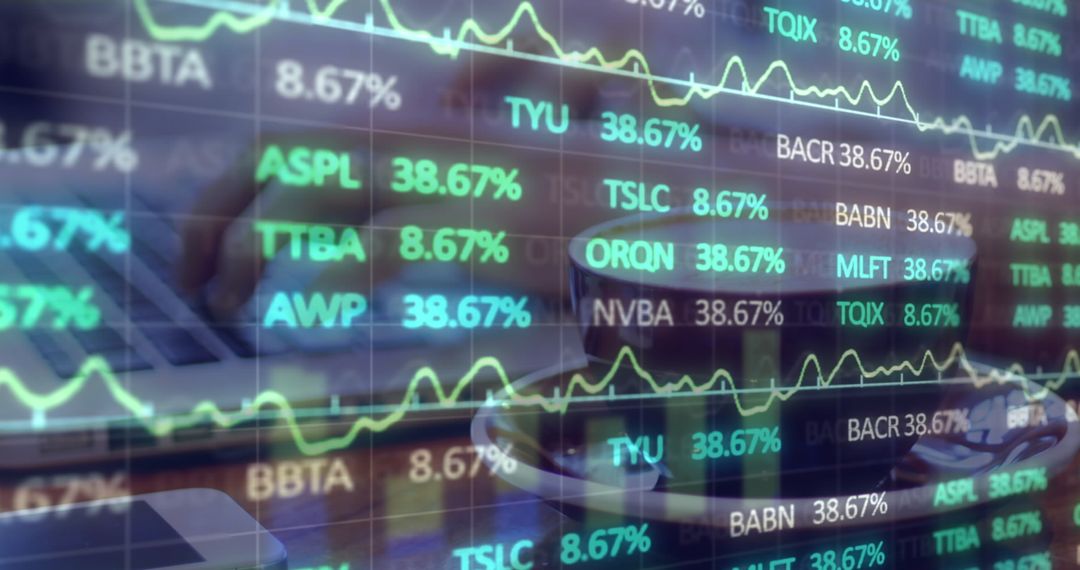
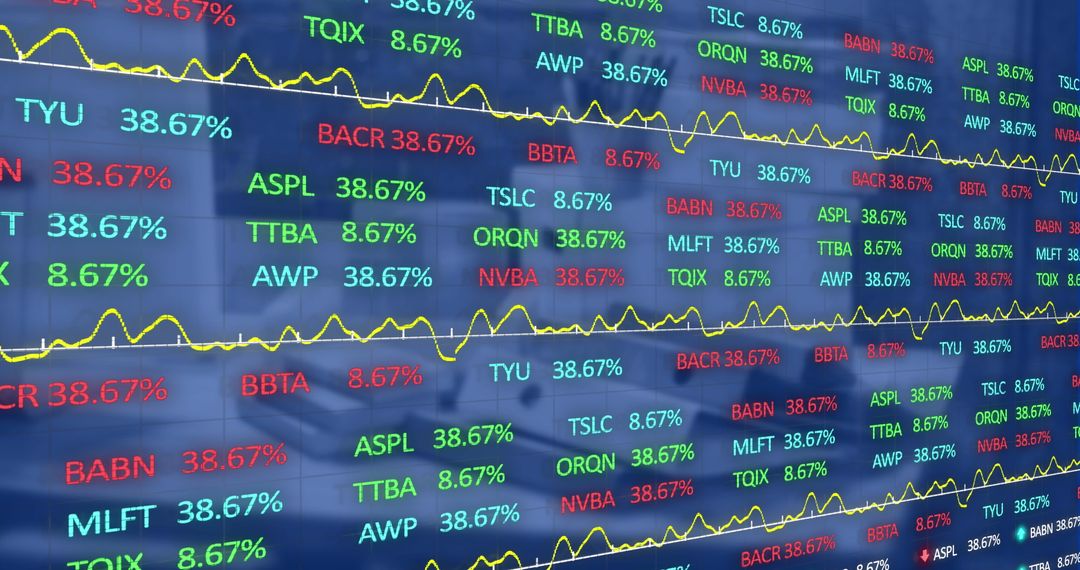
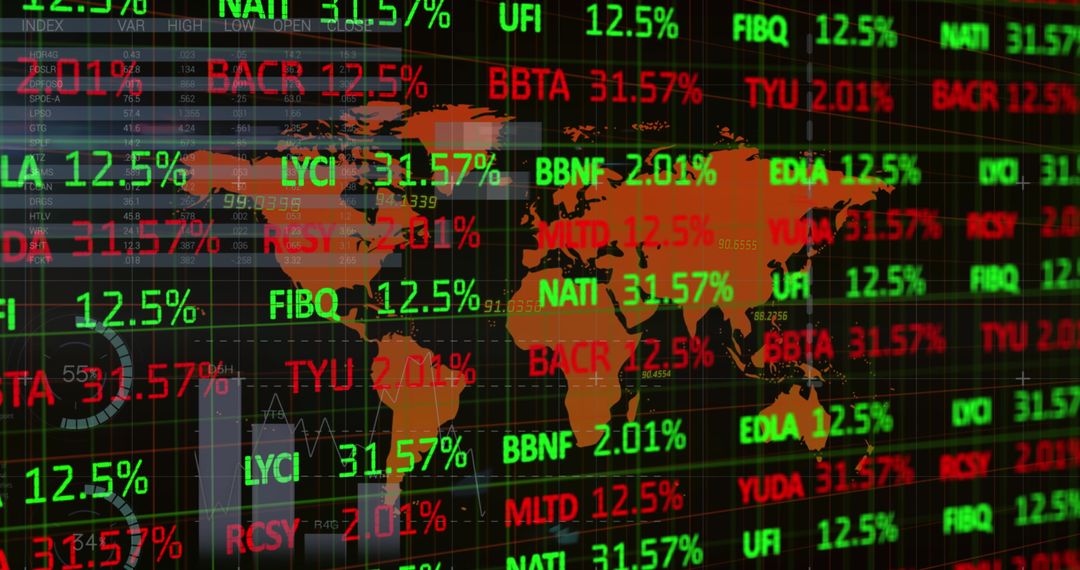
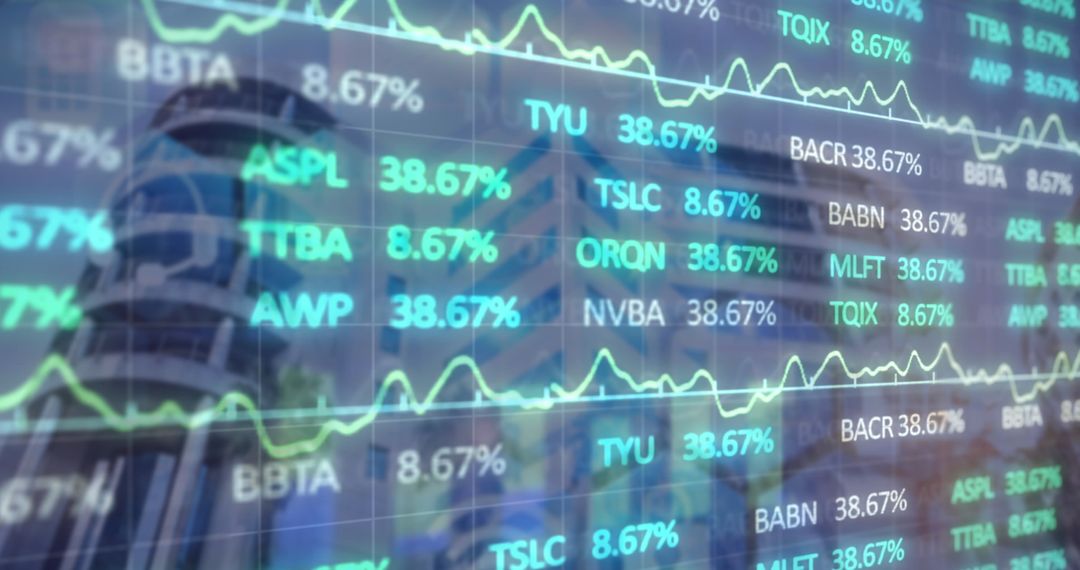
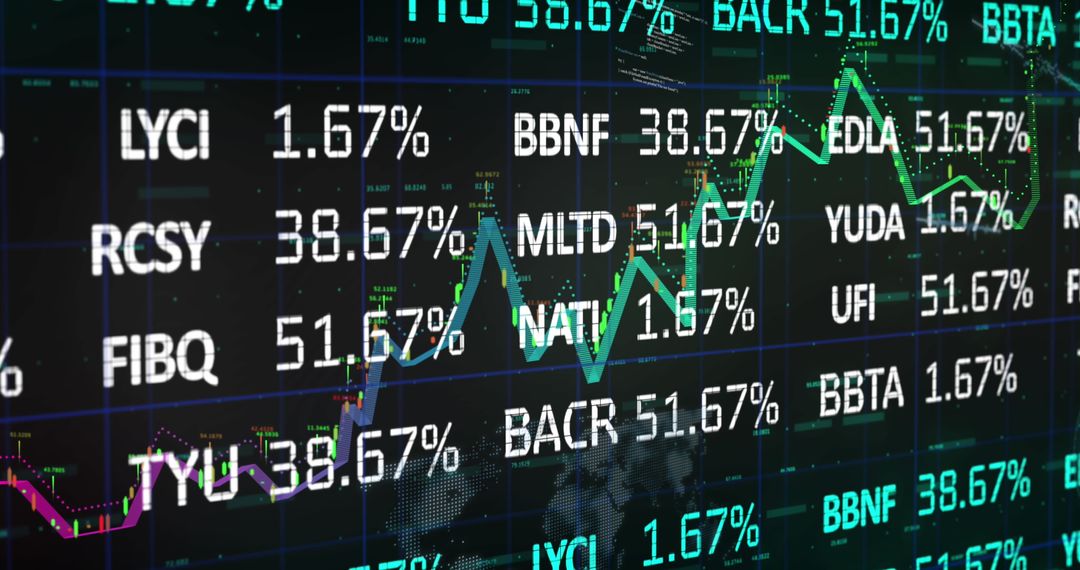
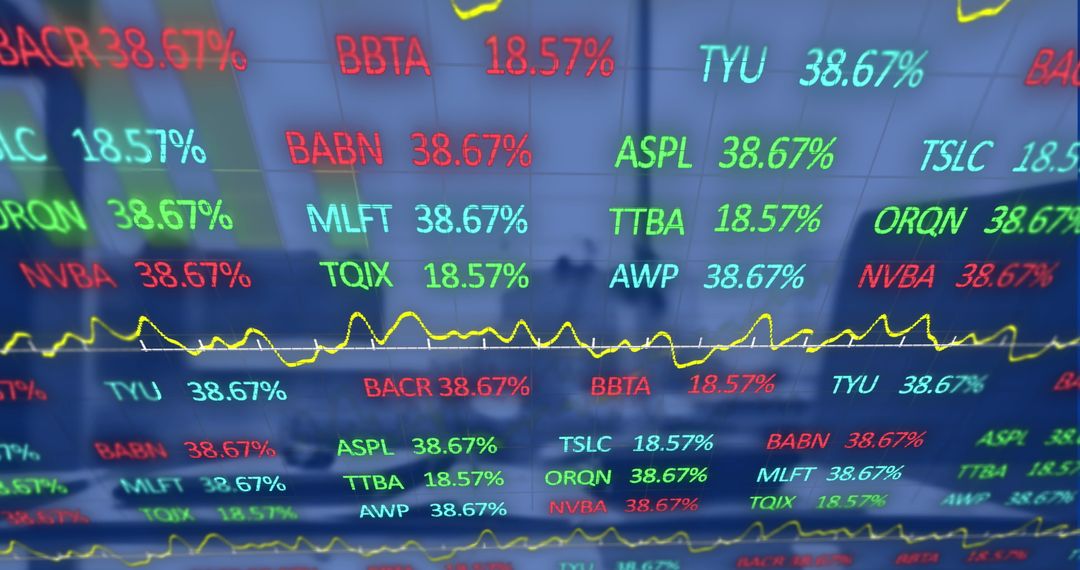
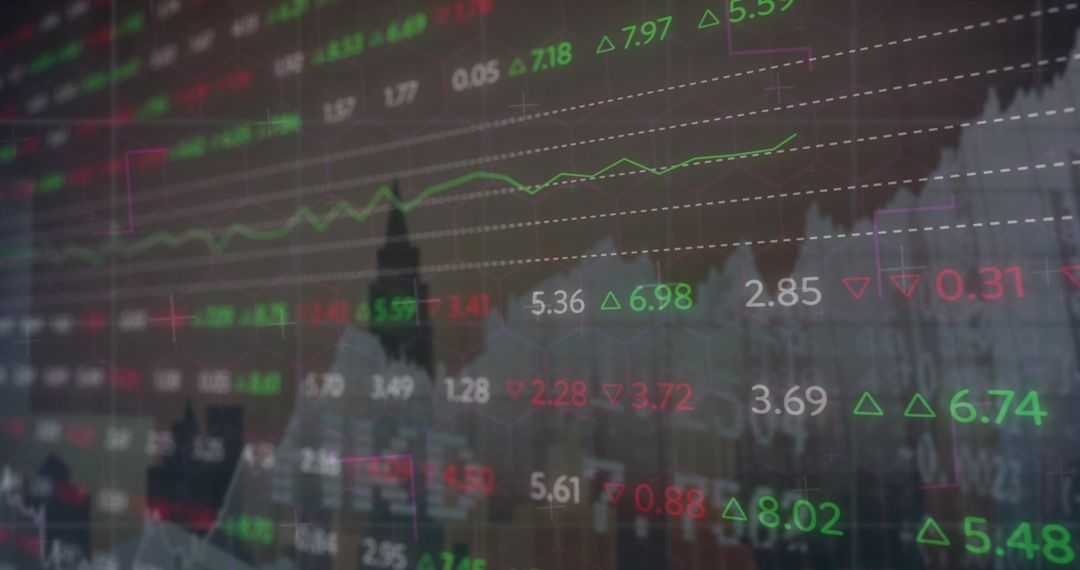
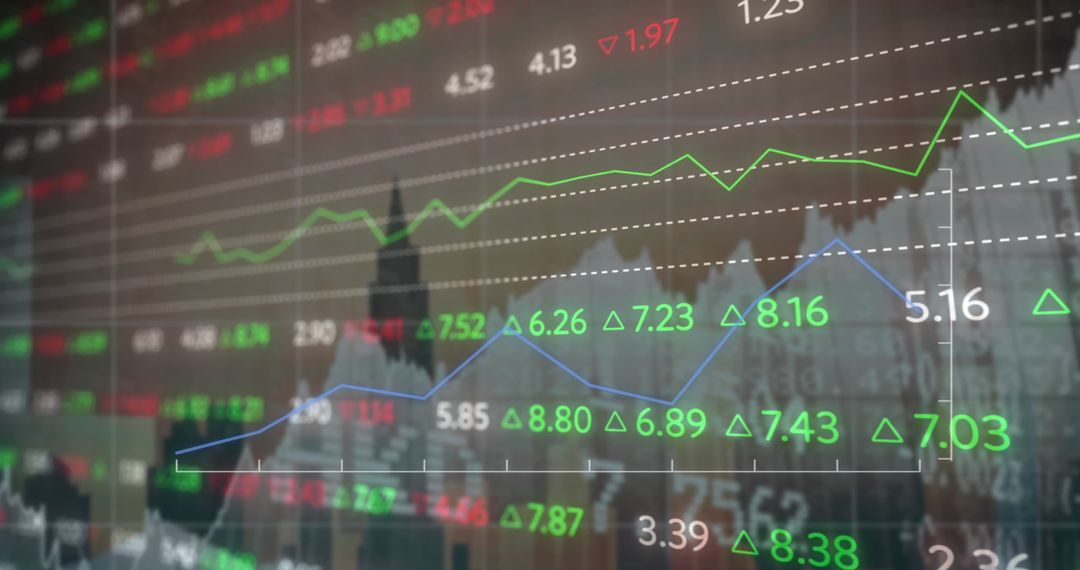
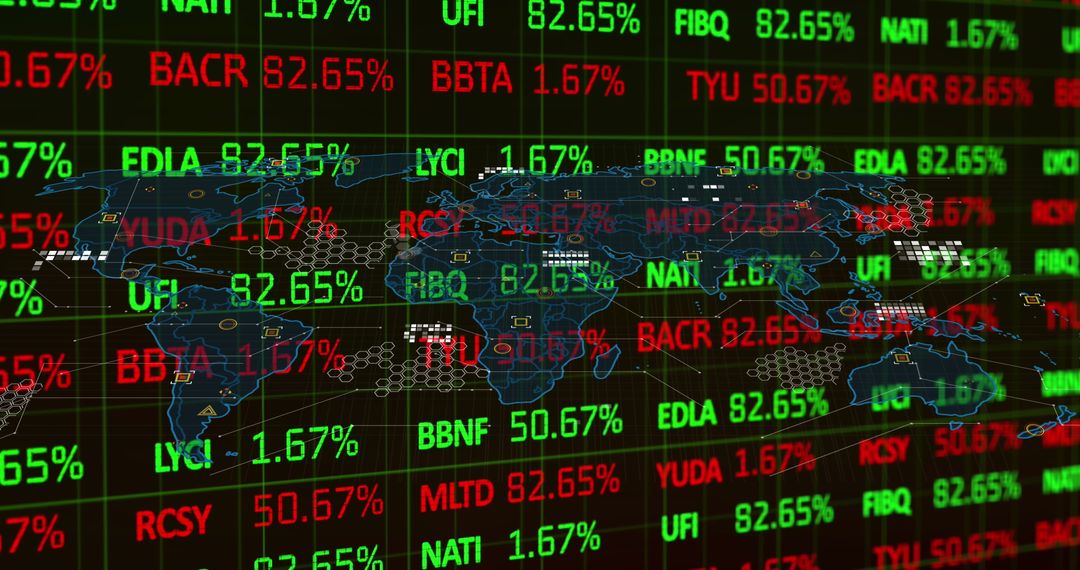
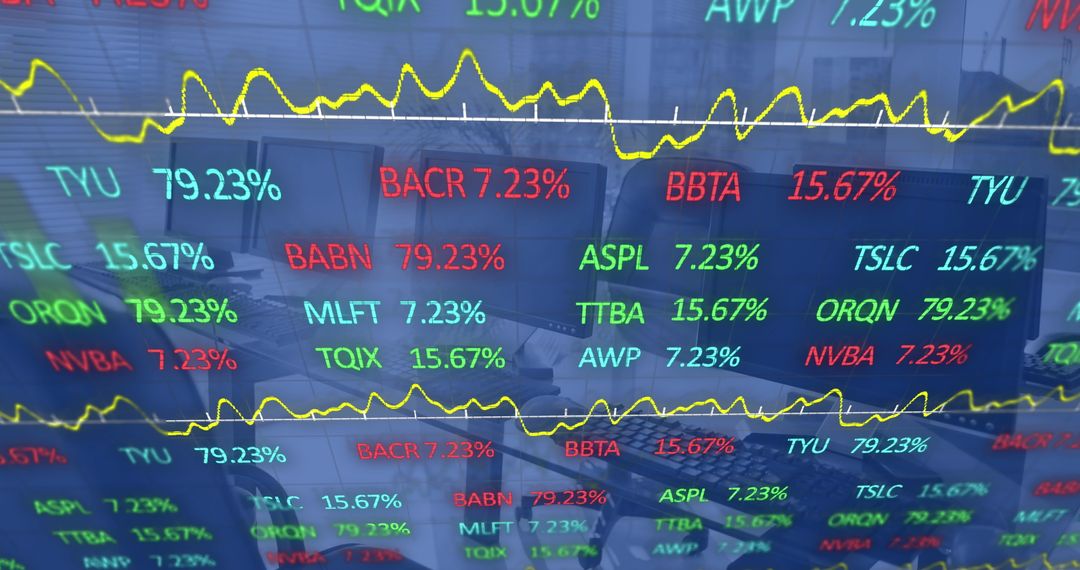
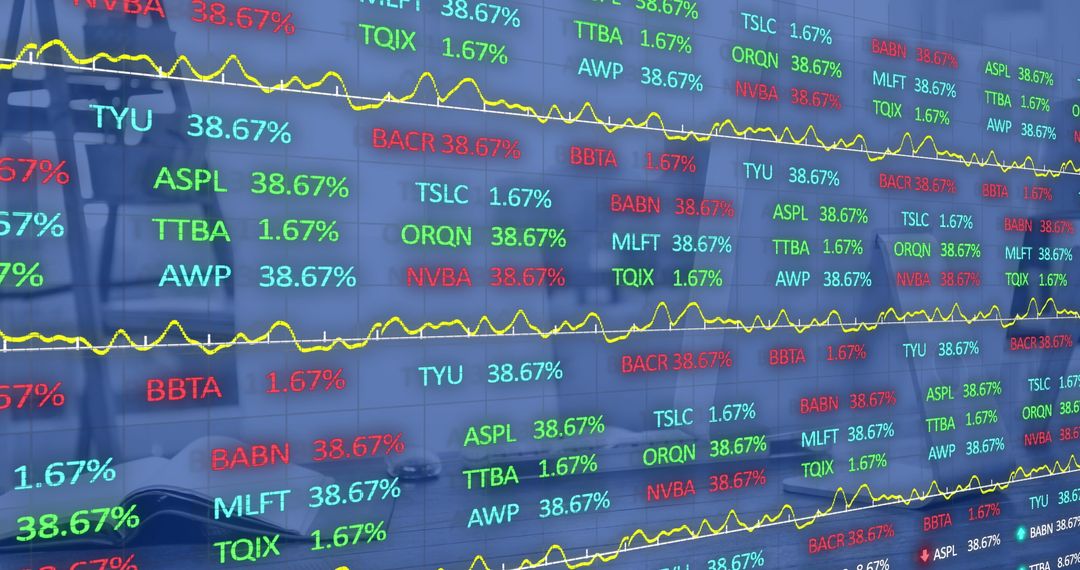
AI Generated Image. Depicts a male broker engaged in tracking real-time stock market data using several display screens filled with financial charts and stock values. Highlights dynamic trends and global business activities. Valuable for articles about the financial sector, trading strategies, technology in finance, or illustrations of the modern trading environment.
Powered by 


3
downloads
downloads
Tags:
More
Credit Photo
If you would like to credit the Photo, here are some ways you can do so
Text Link
photo Link
<span class="text-link">
<span>
<a target="_blank" href=https://pikwizard.com/photo/broker-analyzing-real-time-stock-market-data-on-multiple-and-oversized-screens/674215c2ae904fad5c3ba73e0c0d084f/>PikWizard</a>
</span>
</span>
<span class="image-link">
<span
style="margin: 0 0 20px 0; display: inline-block; vertical-align: middle; width: 100%;"
>
<a
target="_blank"
href="https://pikwizard.com/photo/broker-analyzing-real-time-stock-market-data-on-multiple-and-oversized-screens/674215c2ae904fad5c3ba73e0c0d084f/"
style="text-decoration: none; font-size: 10px; margin: 0;"
>
<img src="https://pikwizard.com/pw/medium/674215c2ae904fad5c3ba73e0c0d084f.jpg" style="margin: 0; width: 100%;" alt="" />
<p style="font-size: 12px; margin: 0;">PikWizard</p>
</a>
</span>
</span>
Free (free of charge)
Free for personal and commercial use.
Author: AI Creator
Similar Free Stock Images

Premium


Premium


Premium


Premium


Premium


Premium


Premium


Premium


Premium


Premium


Premium


Premium


Premium


Premium


Premium


Premium


Premium


Premium


Premium


Premium

Premium


Premium


Premium


Premium