- Home >
- Stock Photos >
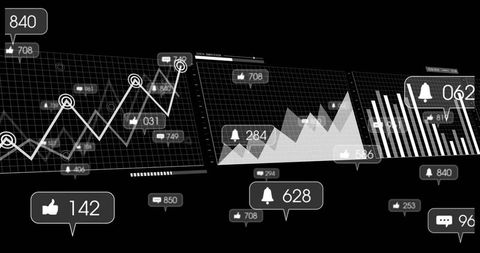
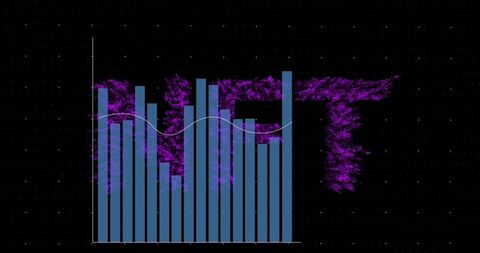
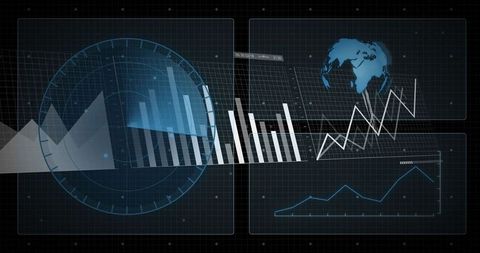
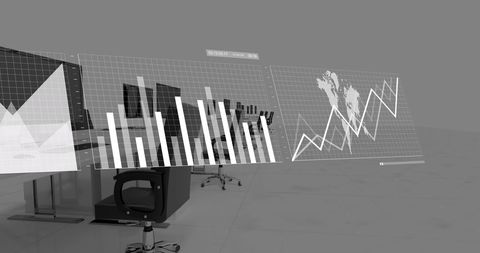
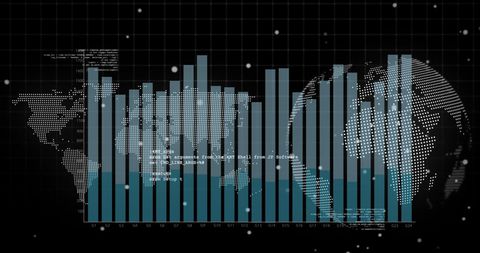
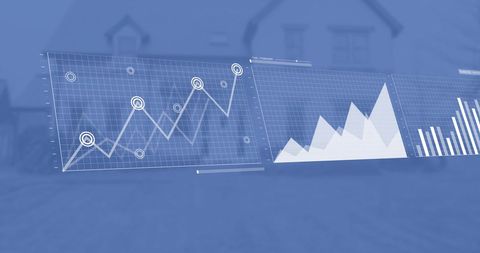
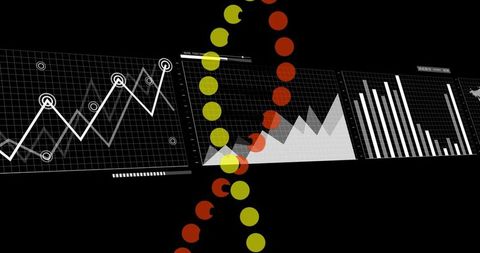
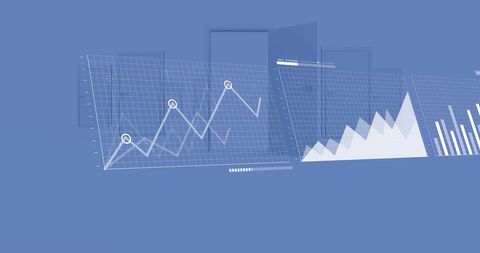
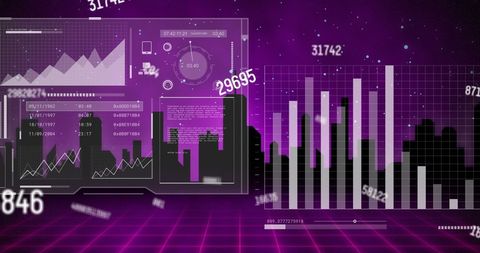
- Business Analytics and Data Visualization on Purple Background
Business Analytics and Data Visualization on Purple Background Image
Dynamic illustration featuring graphs and charts on a purple background, representing business analytics and data visualization. Perfect for use in presentations, reports, or articles on global finance, data analysis, technology, and business performance. Highlights importance of data processing in global connections and financial insights.

downloads
Tags:
More
Credit Photo
If you would like to credit the Photo, here are some ways you can do so
Text Link
photo Link
<span class="text-link">
<span>
<a target="_blank" href=https://pikwizard.com/photo/business-analytics-and-data-visualization-on-purple-background/1aa4d5b604d30f7cb66e142ceff1af4d/>PikWizard</a>
</span>
</span>
<span class="image-link">
<span
style="margin: 0 0 20px 0; display: inline-block; vertical-align: middle; width: 100%;"
>
<a
target="_blank"
href="https://pikwizard.com/photo/business-analytics-and-data-visualization-on-purple-background/1aa4d5b604d30f7cb66e142ceff1af4d/"
style="text-decoration: none; font-size: 10px; margin: 0;"
>
<img src="https://pikwizard.com/pw/medium/1aa4d5b604d30f7cb66e142ceff1af4d.jpg" style="margin: 0; width: 100%;" alt="" />
<p style="font-size: 12px; margin: 0;">PikWizard</p>
</a>
</span>
</span>
Free (free of charge)
Free for personal and commercial use.
Author: People Creations