
- Home >
- Stock Photos >
- Business Analytics and Data Visualization with Decline Trend
Business Analytics and Data Visualization with Decline Trend Image
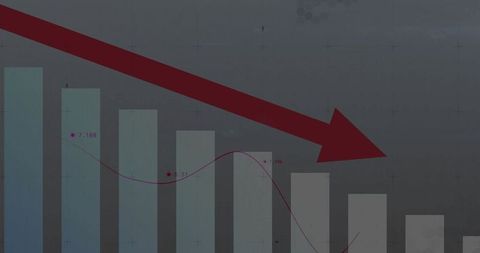
Visualizing a declining trend in business analytics, this illustration can be used in presentations and reports to depict negative changes in data. The diagram shows a combination of bar charts and line graphs, symbolizing a decrease in values. Useful for financial professionals, analysts, and educators for courses and presentations focused on economic downturns, data analysis methodologies, and business strategy adaptations.

downloads
Tags:
More
Credit Photo
If you would like to credit the Photo, here are some ways you can do so
Text Link
photo Link
<span class="text-link">
<span>
<a target="_blank" href=https://pikwizard.com/photo/business-analytics-and-data-visualization-with-decline-trend/79d27b204a66c2fda8c3273fa5419b02/>PikWizard</a>
</span>
</span>
<span class="image-link">
<span
style="margin: 0 0 20px 0; display: inline-block; vertical-align: middle; width: 100%;"
>
<a
target="_blank"
href="https://pikwizard.com/photo/business-analytics-and-data-visualization-with-decline-trend/79d27b204a66c2fda8c3273fa5419b02/"
style="text-decoration: none; font-size: 10px; margin: 0;"
>
<img src="https://pikwizard.com/pw/medium/79d27b204a66c2fda8c3273fa5419b02.jpg" style="margin: 0; width: 100%;" alt="" />
<p style="font-size: 12px; margin: 0;">PikWizard</p>
</a>
</span>
</span>
Free (free of charge)
Free for personal and commercial use.
Author: People Creations