- Home >
- Stock Photos >
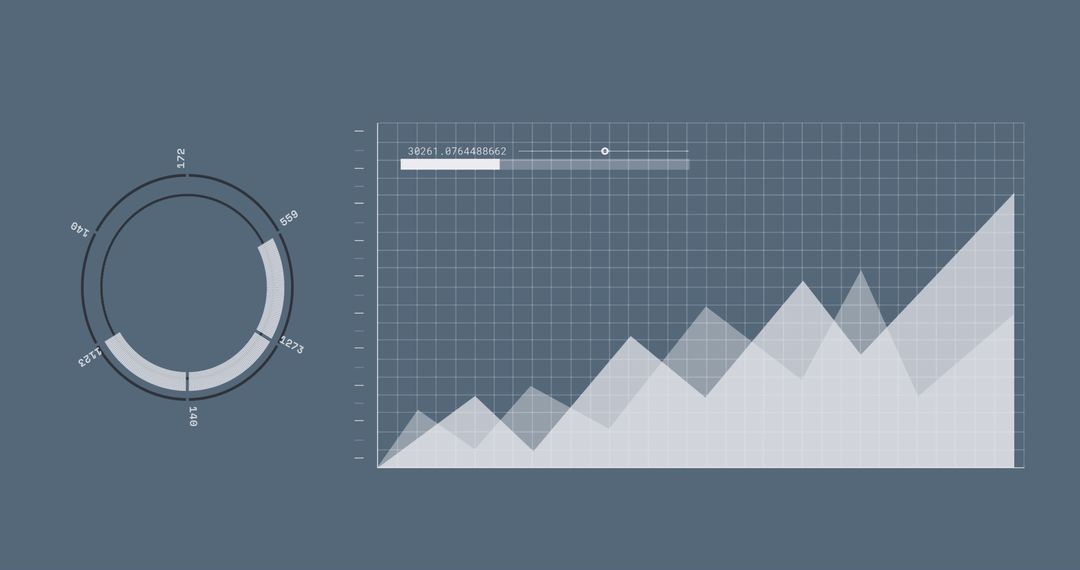
- Business Analytics Data Visualization with Pie and Line Charts
Business Analytics Data Visualization with Pie and Line Charts Image

Modern visual representation of data processing combines pie and line charts, ideal for presentations on business analytics or digital transitions. Useful in illustrating trends, growth metrics, or economic statistics. Suitable for working on projects related to global business strategies or technology-centric interfaces.
Powered by  - Get 15% off with code: PIKWIZARD15


8
downloads
downloads
Tags:
More
Credit Photo
If you would like to credit the Photo, here are some ways you can do so
Text Link
photo Link
<span class="text-link">
<span>
<a target="_blank" href=https://pikwizard.com/photo/business-analytics-data-visualization-with-pie-and-line-charts/0f5a160b6b8251b0f96fd2559098cda4/>PikWizard</a>
</span>
</span>
<span class="image-link">
<span
style="margin: 0 0 20px 0; display: inline-block; vertical-align: middle; width: 100%;"
>
<a
target="_blank"
href="https://pikwizard.com/photo/business-analytics-data-visualization-with-pie-and-line-charts/0f5a160b6b8251b0f96fd2559098cda4/"
style="text-decoration: none; font-size: 10px; margin: 0;"
>
<img src="https://pikwizard.com/pw/medium/0f5a160b6b8251b0f96fd2559098cda4.jpg" style="margin: 0; width: 100%;" alt="" />
<p style="font-size: 12px; margin: 0;">PikWizard</p>
</a>
</span>
</span>
Free (free of charge)
Free for personal and commercial use.
Author: Authentic Images
Similar Free Stock Images

Premium


Premium


Premium


Premium


Premium


Premium


Premium


Premium


Premium


Premium


Premium


Premium


Premium


Premium


Premium


Premium


Premium


Premium


Premium


Premium


Premium


Premium


Premium


Premium