
- Home >
- Stock Photos >
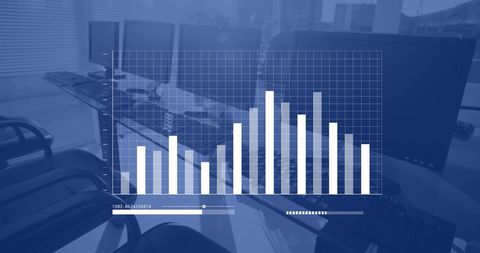
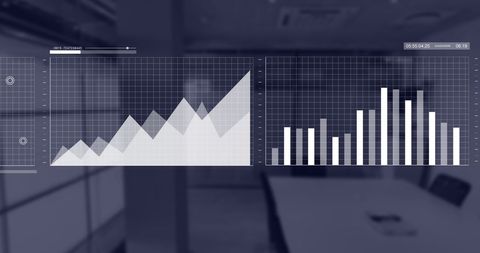
- Business Analytics Graphs on Digital Interface
Business Analytics Graphs on Digital Interface Image

Multiple graphs and charts displayed on digital interface convey progress and performance, suitable for illustrating business analytics, global operations, and technological advancements in data visualization contexts. Useful for presentations, financial reports, or websites related to business strategy and performance metrics.
Powered by  - Get 15% off with code: PIKWIZARD15


downloads
Tags:
More
Credit Photo
If you would like to credit the Photo, here are some ways you can do so
Text Link
photo Link
<span class="text-link">
<span>
<a target="_blank" href=https://pikwizard.com/photo/business-analytics-graphs-on-digital-interface/ee2845bba35d9d8047375cdbb5ccd2d1/>PikWizard</a>
</span>
</span>
<span class="image-link">
<span
style="margin: 0 0 20px 0; display: inline-block; vertical-align: middle; width: 100%;"
>
<a
target="_blank"
href="https://pikwizard.com/photo/business-analytics-graphs-on-digital-interface/ee2845bba35d9d8047375cdbb5ccd2d1/"
style="text-decoration: none; font-size: 10px; margin: 0;"
>
<img src="https://pikwizard.com/pw/medium/ee2845bba35d9d8047375cdbb5ccd2d1.jpg" style="margin: 0; width: 100%;" alt="" />
<p style="font-size: 12px; margin: 0;">PikWizard</p>
</a>
</span>
</span>
Free (free of charge)
Free for personal and commercial use.
Author: Authentic Images
Similar Free Stock Images

Premium


Premium


Premium


Premium

Premium


Premium


Premium


Premium


Premium


Premium


Premium


Premium

Premium


Premium

Premium


Premium


Premium


Premium

Premium


Premium


Premium


Premium

Premium


Premium


Premium
Explore More Free Stock Images