
- Home >
- Stock Photos >
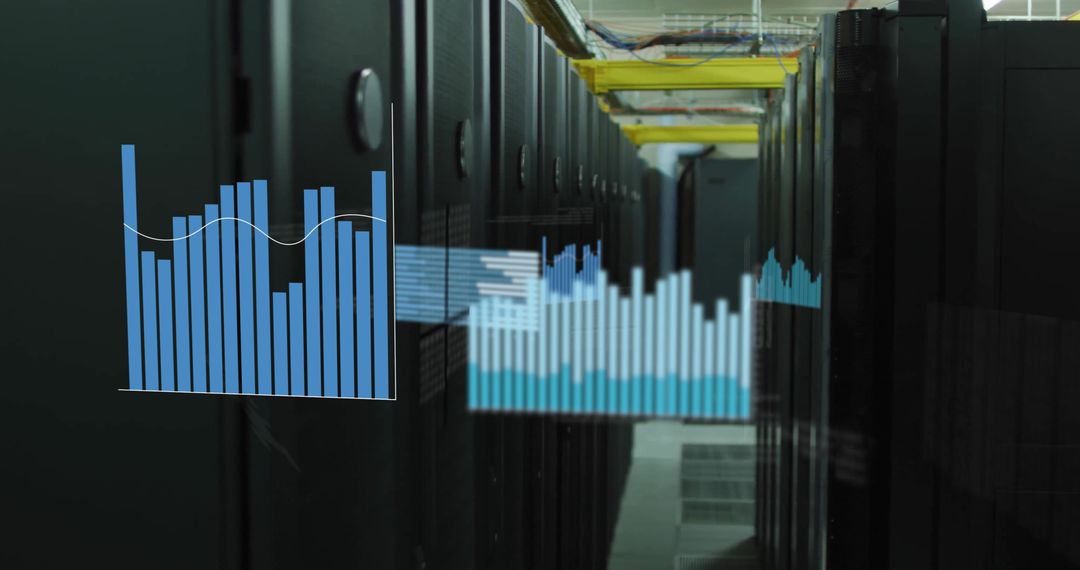
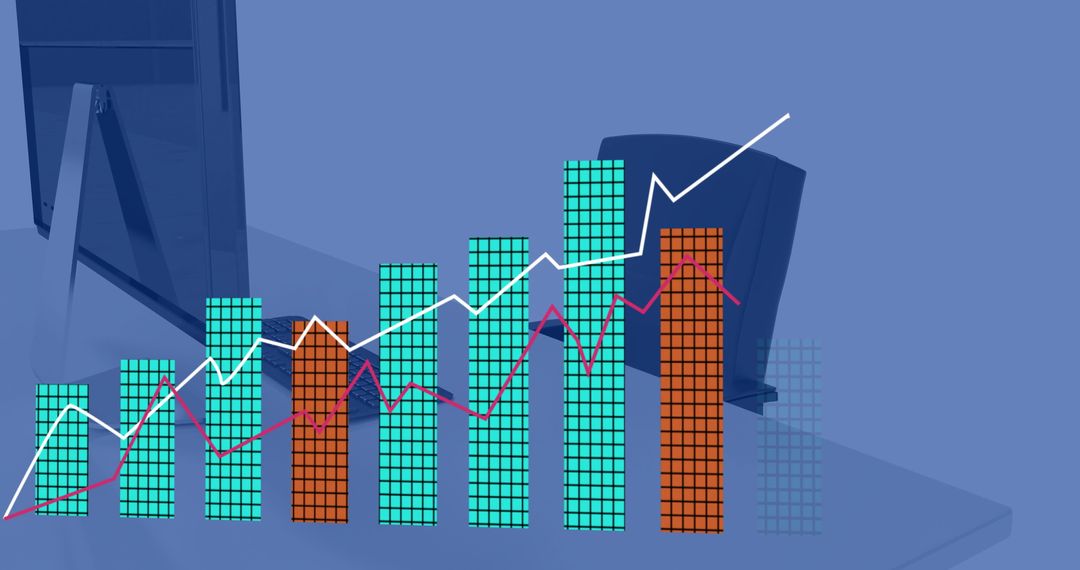
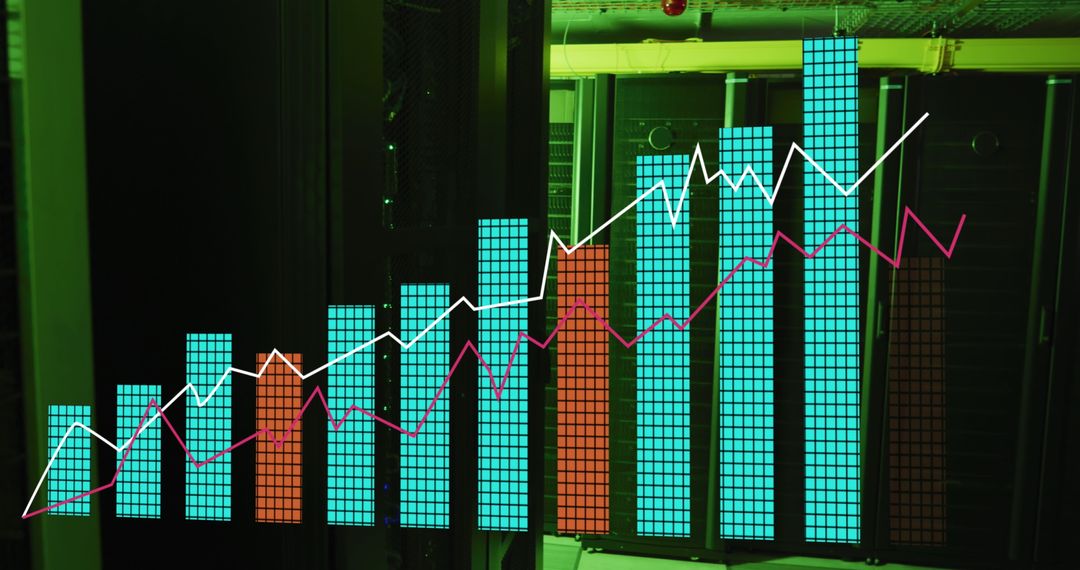
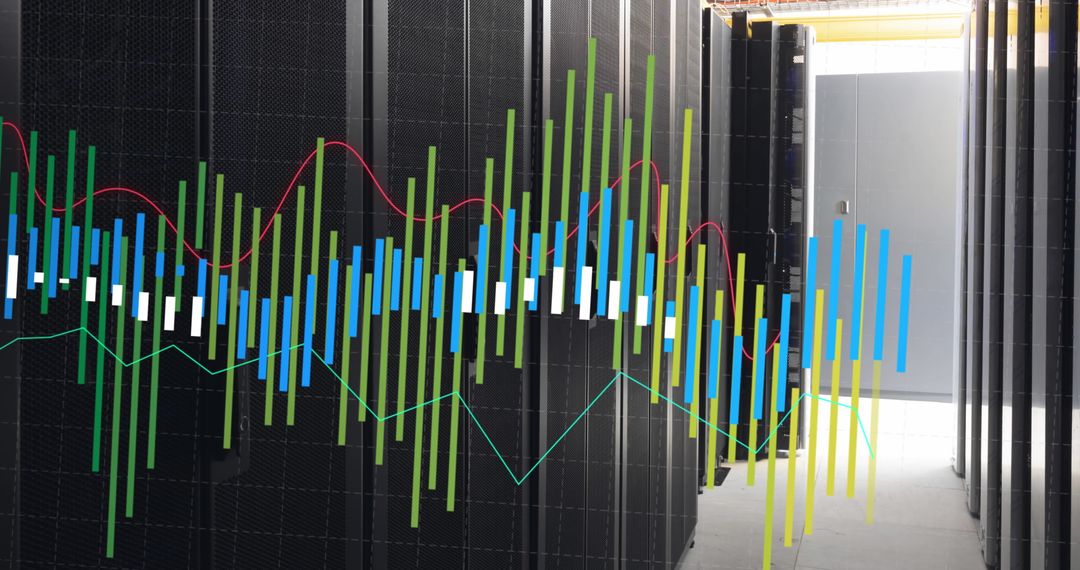
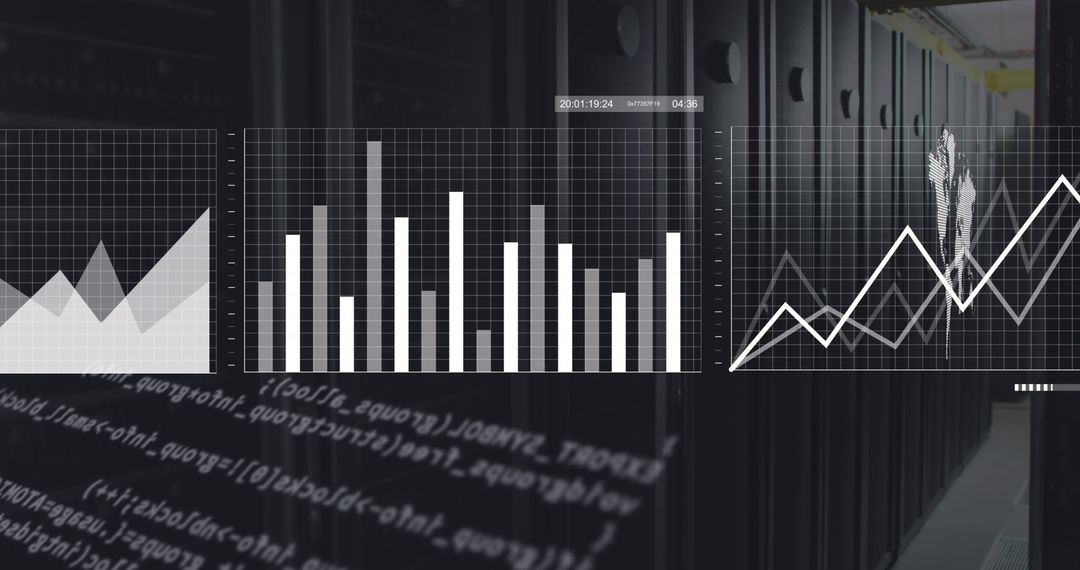
- Business Analytics Graphs Overlaid on Data Center Servers
Business Analytics Graphs Overlaid on Data Center Servers Image

The digital composite image shows colorful graphs over a background of server racks, representing the concept of data analysis and business intelligence within a technological environment. Useful for articles and content related to growth and analytics in the IT sector, as well as presentations on business strategy and technology integration.
Powered by  - Get 15% off with code: PIKWIZARD15


2
downloads
downloads
Tags:
More
Credit Photo
If you would like to credit the Photo, here are some ways you can do so
Text Link
photo Link
<span class="text-link">
<span>
<a target="_blank" href=https://pikwizard.com/photo/business-analytics-graphs-overlaid-on-data-center-servers/0635b58ab590da2acd06ad0a912df226/>PikWizard</a>
</span>
</span>
<span class="image-link">
<span
style="margin: 0 0 20px 0; display: inline-block; vertical-align: middle; width: 100%;"
>
<a
target="_blank"
href="https://pikwizard.com/photo/business-analytics-graphs-overlaid-on-data-center-servers/0635b58ab590da2acd06ad0a912df226/"
style="text-decoration: none; font-size: 10px; margin: 0;"
>
<img src="https://pikwizard.com/pw/medium/0635b58ab590da2acd06ad0a912df226.jpg" style="margin: 0; width: 100%;" alt="" />
<p style="font-size: 12px; margin: 0;">PikWizard</p>
</a>
</span>
</span>
Free (free of charge)
Free for personal and commercial use.
Author: People Creations
Similar Free Stock Images

Premium


Premium


Premium


Premium


Premium


Premium


Premium


Premium


Premium


Premium


Premium


Premium


Premium


Premium


Premium


Premium


Premium


Premium


Premium


Premium


Premium


Premium


Premium


Premium

