- Home >
- Stock Photos >
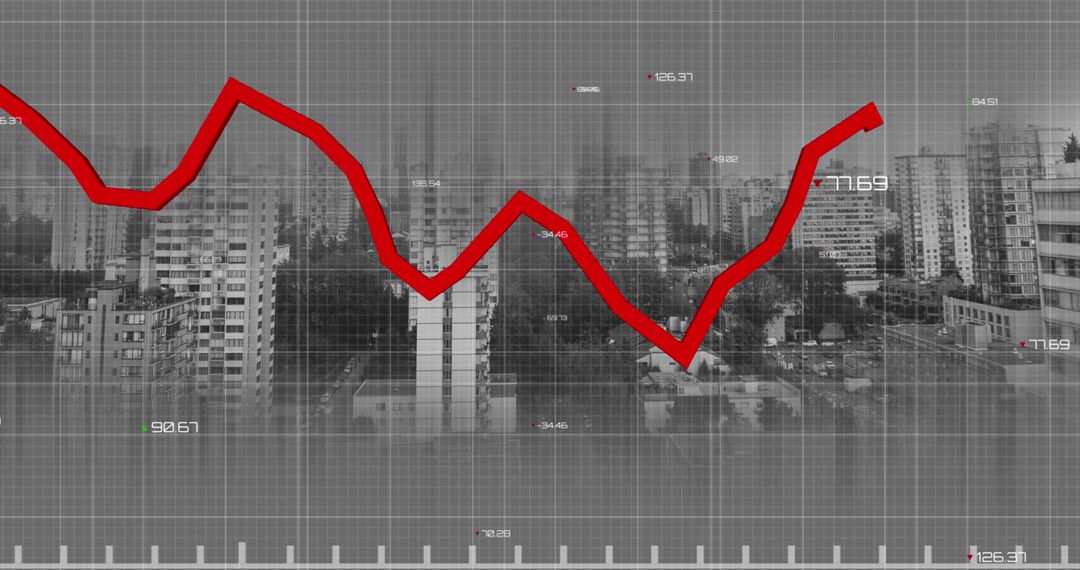
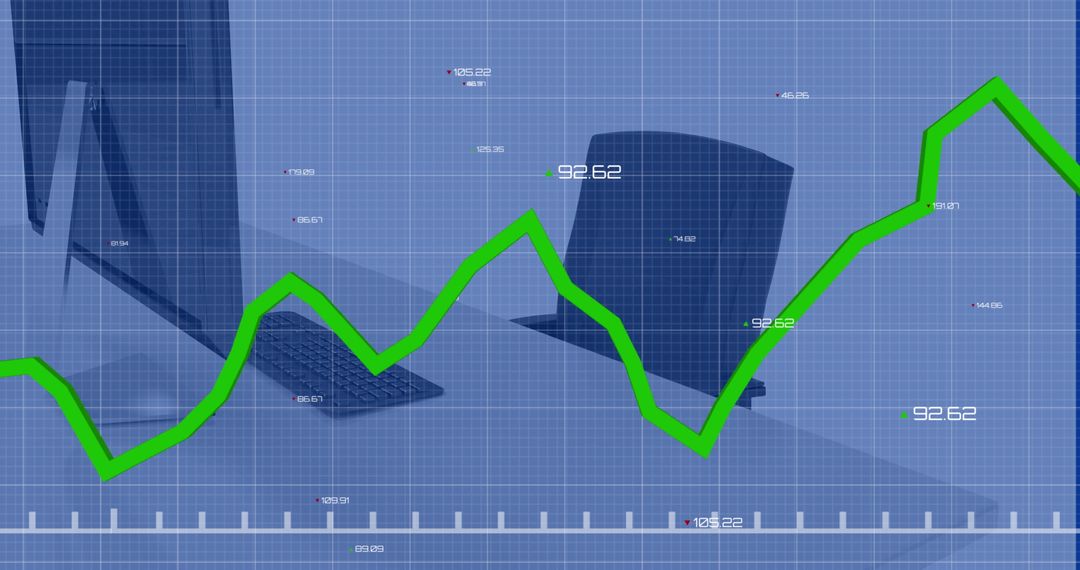
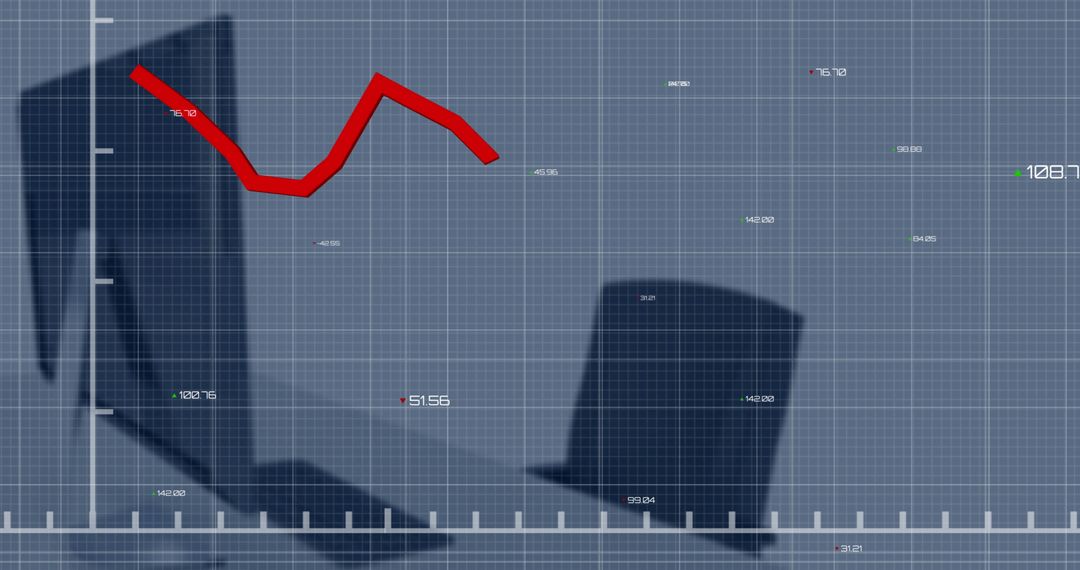
- Business Analytics with Declining Graph Overlay App Display Concept
Business Analytics with Declining Graph Overlay App Display Concept Image

This image portrays a business environment with a prominent graph outlining financial decline. Ideal for illustrating concepts related to economic analysis, market research, and corporate financial reports. Perfect for presentations and articles discussing business trends and downturn effects.
Powered by 


2
downloads
downloads
Tags:
More
Credit Photo
If you would like to credit the Photo, here are some ways you can do so
Text Link
photo Link
<span class="text-link">
<span>
<a target="_blank" href=https://pikwizard.com/photo/business-analytics-with-declining-graph-overlay-app-display-concept/a4ab996453049503c5081fd22ce10b10/>PikWizard</a>
</span>
</span>
<span class="image-link">
<span
style="margin: 0 0 20px 0; display: inline-block; vertical-align: middle; width: 100%;"
>
<a
target="_blank"
href="https://pikwizard.com/photo/business-analytics-with-declining-graph-overlay-app-display-concept/a4ab996453049503c5081fd22ce10b10/"
style="text-decoration: none; font-size: 10px; margin: 0;"
>
<img src="https://pikwizard.com/pw/medium/a4ab996453049503c5081fd22ce10b10.jpg" style="margin: 0; width: 100%;" alt="" />
<p style="font-size: 12px; margin: 0;">PikWizard</p>
</a>
</span>
</span>
Free (free of charge)
Free for personal and commercial use.
Author: People Creations
Similar Free Stock Images
Premium


Premium


Premium


Premium


Premium


Premium


Premium


Premium


Premium


Premium


Premium


Premium


Premium


Premium


Premium


Premium


Premium


Premium


Premium


Premium


Premium


Premium


Premium


Premium