- Home >
- Stock Photos >
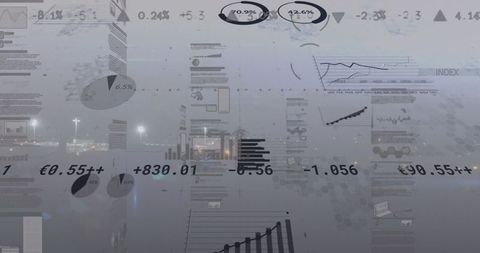
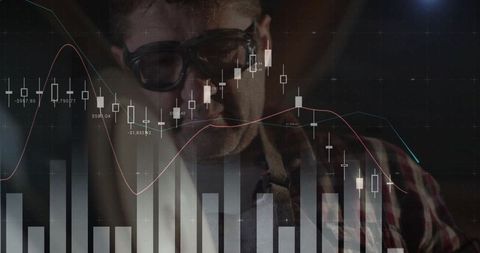
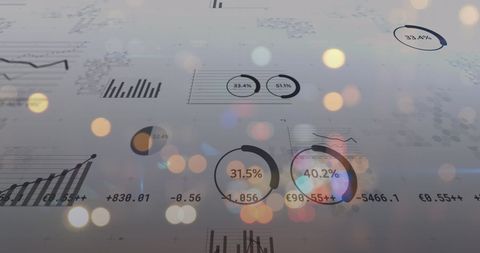
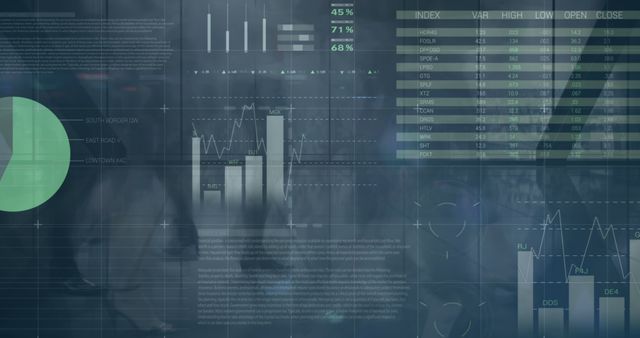
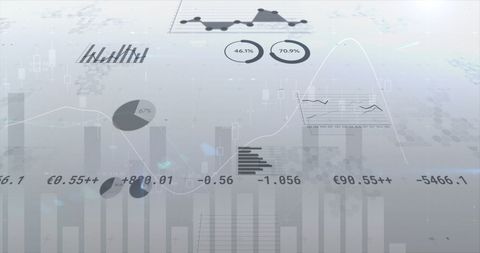
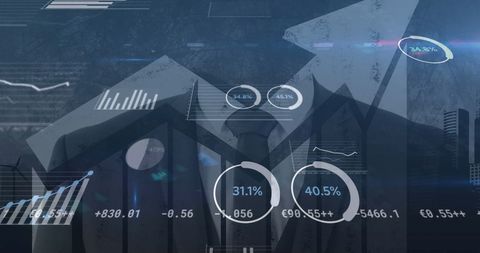
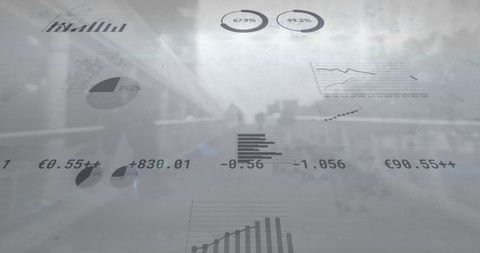
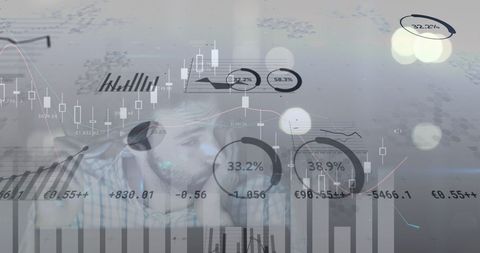
- Business Analytics with Financial Graphs and Charts Overlay
Business Analytics with Financial Graphs and Charts Overlay Image

Scene highlighting businessman analyzing financial data with graphs and charts overlaying his workspace. Represents concepts like financial analytics, data-driven decisions, economic trends, strategic management, market research. Suitable for presentations on finance, investment strategies, business development.
Powered by 


0
downloads
downloads
Tags:
More
Credit Photo
If you would like to credit the Photo, here are some ways you can do so
Text Link
photo Link
<span class="text-link">
<span>
<a target="_blank" href=https://pikwizard.com/photo/business-analytics-with-financial-graphs-and-charts-overlay/c99ea5d7ab52ae727cd1e2e10e7e3357/>PikWizard</a>
</span>
</span>
<span class="image-link">
<span
style="margin: 0 0 20px 0; display: inline-block; vertical-align: middle; width: 100%;"
>
<a
target="_blank"
href="https://pikwizard.com/photo/business-analytics-with-financial-graphs-and-charts-overlay/c99ea5d7ab52ae727cd1e2e10e7e3357/"
style="text-decoration: none; font-size: 10px; margin: 0;"
>
<img src="https://pikwizard.com/pw/medium/c99ea5d7ab52ae727cd1e2e10e7e3357.jpg" style="margin: 0; width: 100%;" alt="" />
<p style="font-size: 12px; margin: 0;">PikWizard</p>
</a>
</span>
</span>
Free (free of charge)
Free for personal and commercial use.
Author: Creative Art
Similar Free Stock Images
Loading...

Premium


Premium


Premium

Premium


Premium


Premium


Premium


Premium


Premium


Premium


Premium


Premium


Premium


Premium

Premium


Premium


Premium


Premium


Premium

Premium


Premium


Premium


Premium

Premium


Premium