- Home >
- Stock Photos >
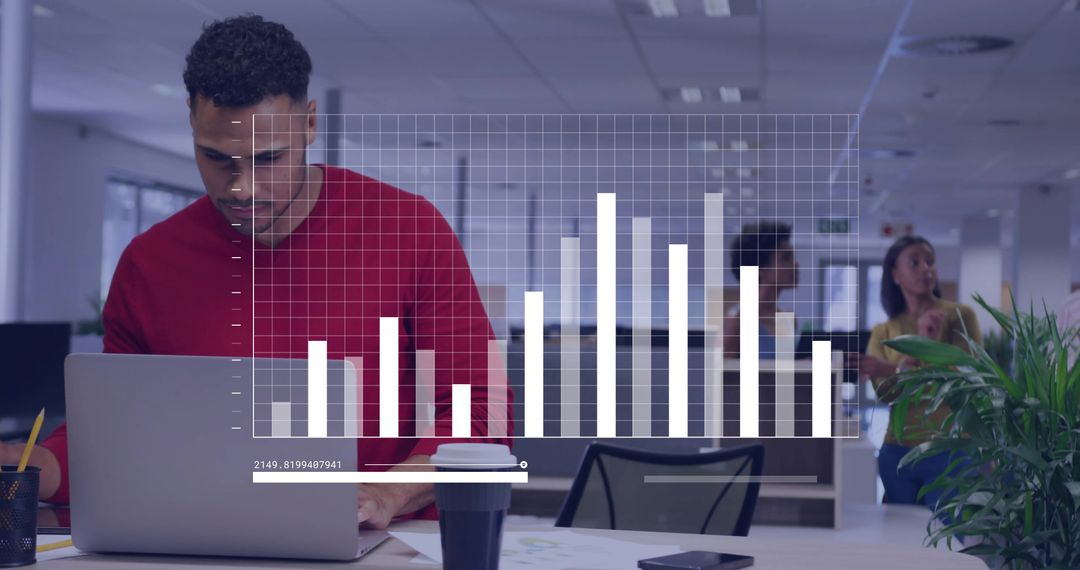
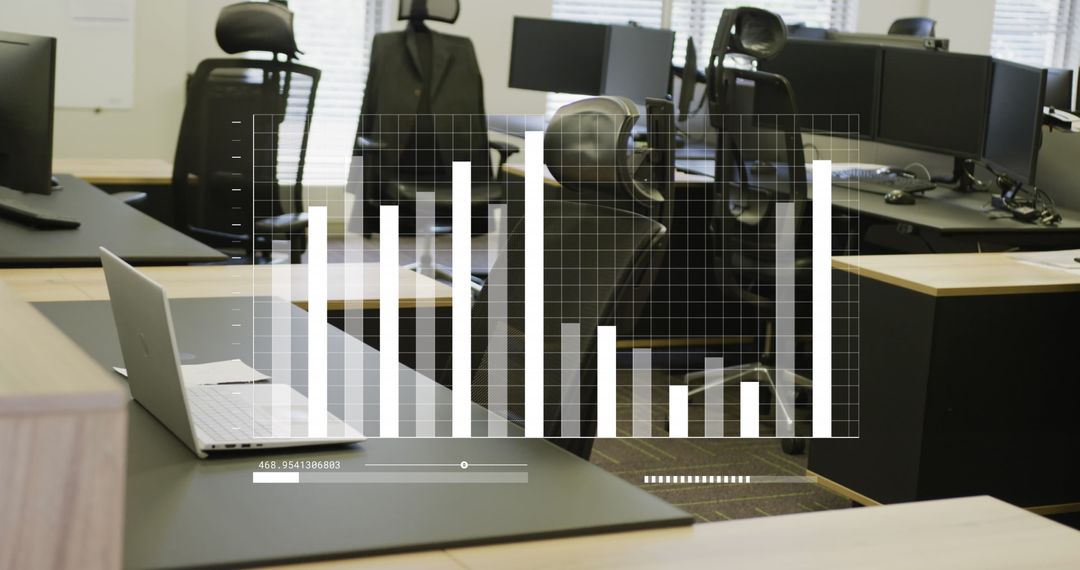
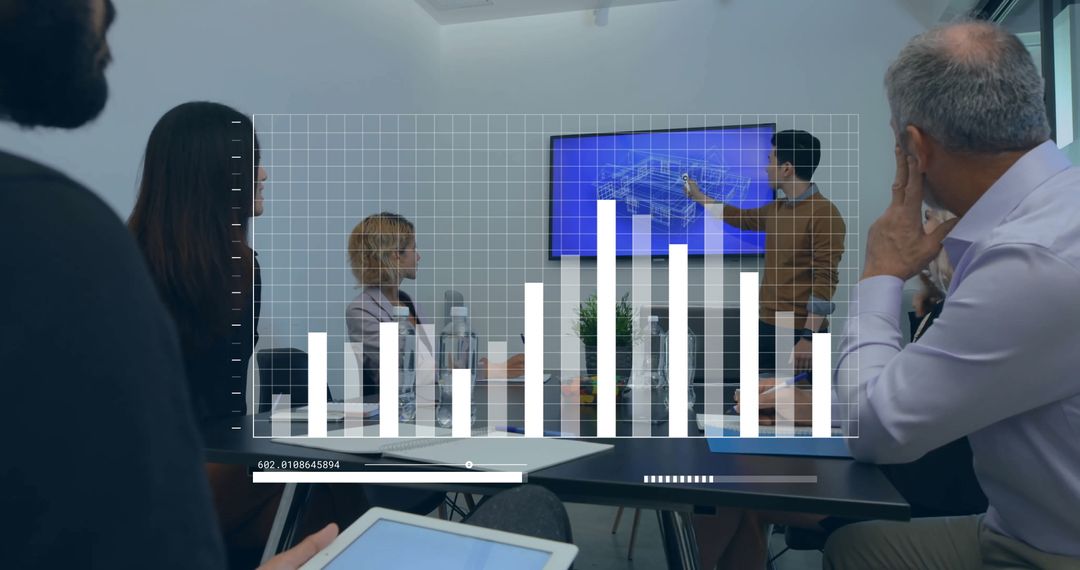
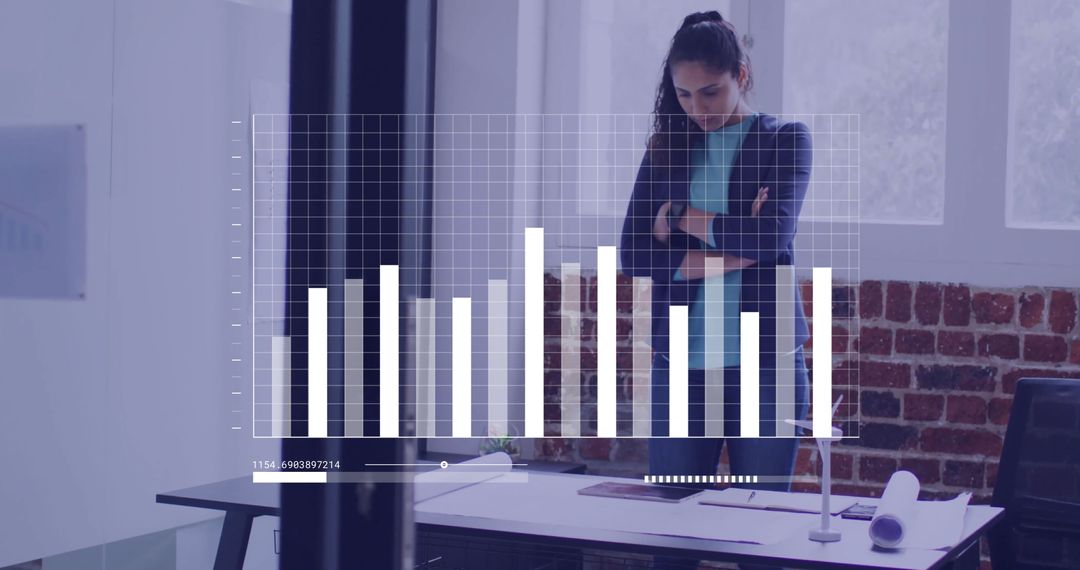
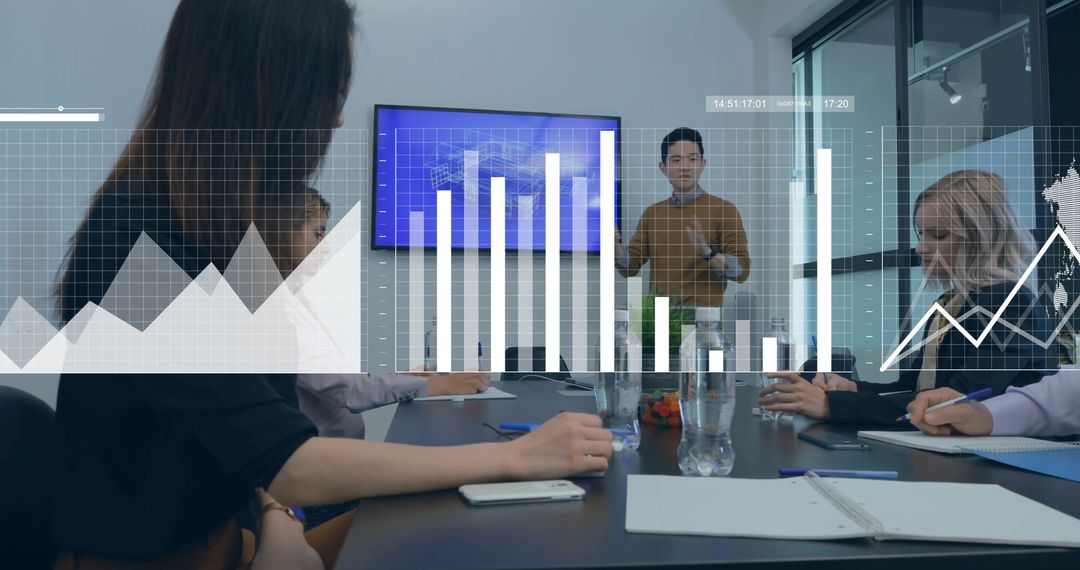
- Business Colleagues Analyzing Data with Augmented Reality Graphs
Business Colleagues Analyzing Data with Augmented Reality Graphs Image

Image shows diverse business professionals collaborating on data analysis using augmented reality charts and graphs in an office. Useful for illustrating concepts of modern business, teamwork, technology in workspace, or digital finance strategies in presentations and articles.
Powered by  - Get 15% off with code: PIKWIZARD15


0
downloads
downloads
Tags:
More
Credit Photo
If you would like to credit the Photo, here are some ways you can do so
Text Link
photo Link
<span class="text-link">
<span>
<a target="_blank" href=https://pikwizard.com/photo/business-colleagues-analyzing-data-with-augmented-reality-graphs/b7888f51eae6bb909d0c3507ecc047a7/>PikWizard</a>
</span>
</span>
<span class="image-link">
<span
style="margin: 0 0 20px 0; display: inline-block; vertical-align: middle; width: 100%;"
>
<a
target="_blank"
href="https://pikwizard.com/photo/business-colleagues-analyzing-data-with-augmented-reality-graphs/b7888f51eae6bb909d0c3507ecc047a7/"
style="text-decoration: none; font-size: 10px; margin: 0;"
>
<img src="https://pikwizard.com/pw/medium/b7888f51eae6bb909d0c3507ecc047a7.jpg" style="margin: 0; width: 100%;" alt="" />
<p style="font-size: 12px; margin: 0;">PikWizard</p>
</a>
</span>
</span>
Free (free of charge)
Free for personal and commercial use.
Author: People Creations
Similar Free Stock Images

Premium


Premium


Premium


Premium


Premium


Premium


Premium


Premium


Premium


Premium


Premium


Premium


Premium


Premium


Premium


Premium


Premium


Premium


Premium


Premium


Premium


Premium


Premium


Premium