
- Home >
- Stock Photos >
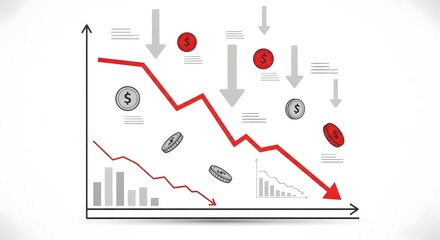
- Business Crisis Concept Showing Downturn Graph Over Empty Office
Business Crisis Concept Showing Downturn Graph Over Empty Office Image

Visual representation of economic decline highlighted by overlaying a declining bar graph over a modern, empty office setting. This image illustrates concepts of financial difficulties, business stress related to inflation or a recession, ideal for articles, reports, or presentations discussing economic challenges and business impacts. It can be used by journalists, financial analysts, and economic commentators.
Powered by 


2
downloads
downloads
Tags:
More
Credit Photo
If you would like to credit the Photo, here are some ways you can do so
Text Link
photo Link
<span class="text-link">
<span>
<a target="_blank" href=https://pikwizard.com/photo/business-crisis-concept-showing-downturn-graph-over-empty-office/1d01a5c9570cd170cfdf30af04b292d2/>PikWizard</a>
</span>
</span>
<span class="image-link">
<span
style="margin: 0 0 20px 0; display: inline-block; vertical-align: middle; width: 100%;"
>
<a
target="_blank"
href="https://pikwizard.com/photo/business-crisis-concept-showing-downturn-graph-over-empty-office/1d01a5c9570cd170cfdf30af04b292d2/"
style="text-decoration: none; font-size: 10px; margin: 0;"
>
<img src="https://pikwizard.com/pw/medium/1d01a5c9570cd170cfdf30af04b292d2.jpg" style="margin: 0; width: 100%;" alt="" />
<p style="font-size: 12px; margin: 0;">PikWizard</p>
</a>
</span>
</span>
Free (free of charge)
Free for personal and commercial use.
Author: Creative Art
Similar Free Stock Images

Premium


Premium


Premium


Premium


Premium


Premium


Premium


Premium


Premium


Premium


Premium


Premium


Premium


Premium


Premium


Premium


Premium


Premium


Premium


Premium


Premium


Premium


Premium


Premium


Premium

