
- Home >
- Stock Photos >
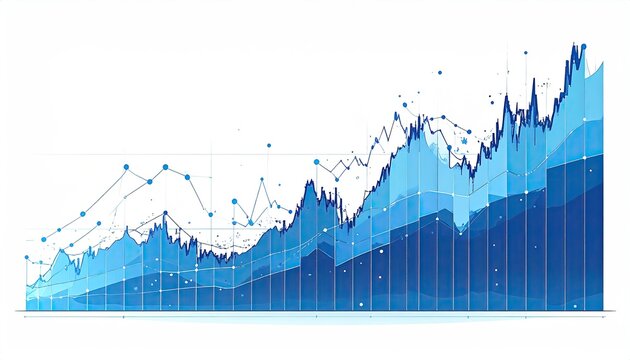
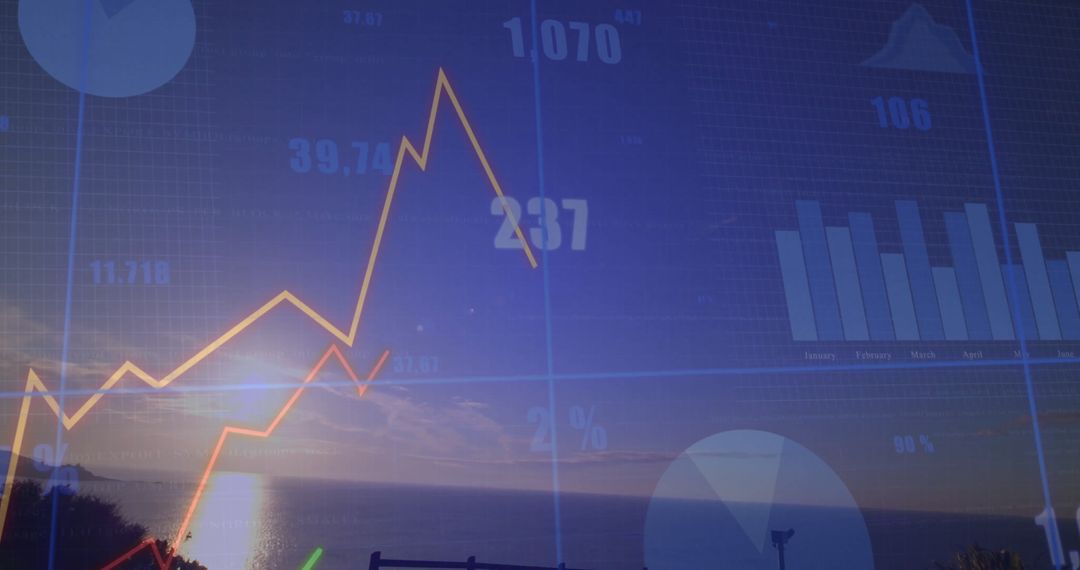
- Business Dashboard with dynamic data analytics in a conference room
Business Dashboard with dynamic data analytics in a conference room Image
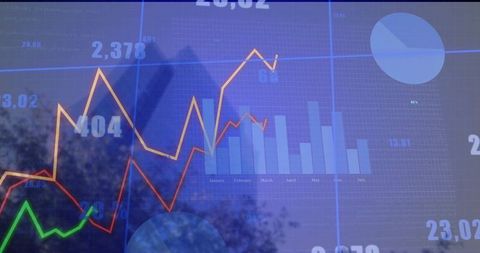
Represents a futuristic and professional business environment. Useful for articles or presentations discussing data solutions, statistical analysis, advanced business intelligence, and technology innovation. Suitable for websites or marketing materials that focus on modern and dynamic decision-making and analytics tools in corporate settings.
Powered by 


0
downloads
downloads
Tags:
More
Credit Photo
If you would like to credit the Photo, here are some ways you can do so
Text Link
photo Link
<span class="text-link">
<span>
<a target="_blank" href=https://pikwizard.com/photo/business-dashboard-with-dynamic-data-analytics-in-a-conference-room/ff2fb71848cad48f1e5d6f6f7beb720a/>PikWizard</a>
</span>
</span>
<span class="image-link">
<span
style="margin: 0 0 20px 0; display: inline-block; vertical-align: middle; width: 100%;"
>
<a
target="_blank"
href="https://pikwizard.com/photo/business-dashboard-with-dynamic-data-analytics-in-a-conference-room/ff2fb71848cad48f1e5d6f6f7beb720a/"
style="text-decoration: none; font-size: 10px; margin: 0;"
>
<img src="https://pikwizard.com/pw/medium/ff2fb71848cad48f1e5d6f6f7beb720a.jpg" style="margin: 0; width: 100%;" alt="" />
<p style="font-size: 12px; margin: 0;">PikWizard</p>
</a>
</span>
</span>
Free (free of charge)
Free for personal and commercial use.
Author: Authentic Images
Similar Free Stock Images

Premium


Premium


Premium


Premium


Premium


Premium


Premium


Premium


Premium


Premium


Premium


Premium


Premium


Premium


Premium


Premium


Premium


Premium


Premium


Premium


Premium


Premium


Premium


Premium

