- Home >
- Stock Photos >
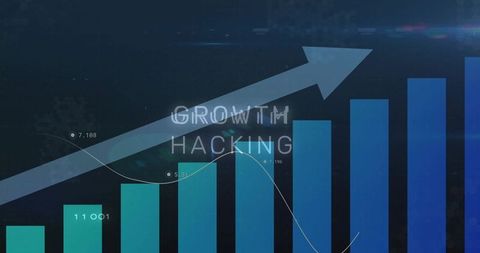
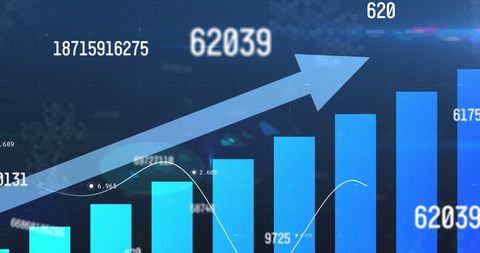
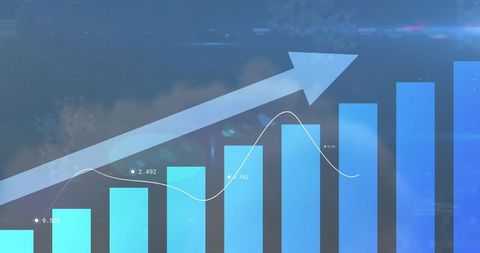
- Business Data Analysis and Networking with Graphs and Progress
Business Data Analysis and Networking with Graphs and Progress Image

Visual showcasing business data analysis in a digital context with vibrant graphs, charts, and an emphasis on global connectivity. Ideal for content focused on modern business strategies, technological advancements, financial data insights, or democratizing information using data networks, with a color scheme highlighting innovation and progress.
Powered by 


downloads
Tags:
More
Credit Photo
If you would like to credit the Photo, here are some ways you can do so
Text Link
photo Link
<span class="text-link">
<span>
<a target="_blank" href=https://pikwizard.com/photo/business-data-analysis-and-networking-with-graphs-and-progress/e77d2898fb24d3b61f17800da0534254/>PikWizard</a>
</span>
</span>
<span class="image-link">
<span
style="margin: 0 0 20px 0; display: inline-block; vertical-align: middle; width: 100%;"
>
<a
target="_blank"
href="https://pikwizard.com/photo/business-data-analysis-and-networking-with-graphs-and-progress/e77d2898fb24d3b61f17800da0534254/"
style="text-decoration: none; font-size: 10px; margin: 0;"
>
<img src="https://pikwizard.com/pw/medium/e77d2898fb24d3b61f17800da0534254.jpg" style="margin: 0; width: 100%;" alt="" />
<p style="font-size: 12px; margin: 0;">PikWizard</p>
</a>
</span>
</span>
Free (free of charge)
Free for personal and commercial use.
Author: People Creations
Similar Free Stock Images
Loading...

Premium


Premium

Premium


Premium

Premium


Premium

Premium


Premium


Premium


Premium


Premium


Premium


Premium


Premium


Premium


Premium


Premium


Premium


Premium


Premium


Premium


Premium


Premium


Premium


Premium