- Home >
- Stock Photos >
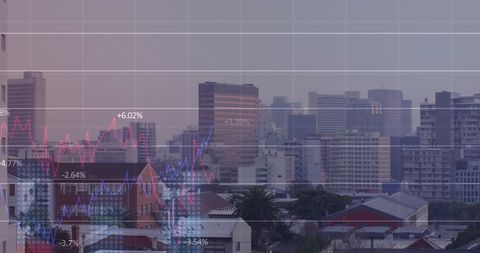
- Business Data Analysis Overlaid on Urban Skyline
Business Data Analysis Overlaid on Urban Skyline Image

Visual juxtaposition of business data and urban landscape conveys sense of financial growth and technological advancement. Suitable for illustrating economic reports, financial presentations, or articles on urban development and technology integration in business.
Powered by  - Get 15% off with code: PIKWIZARD15


2
downloads
downloads
Tags:
More
Credit Photo
If you would like to credit the Photo, here are some ways you can do so
Text Link
photo Link
<span class="text-link">
<span>
<a target="_blank" href=https://pikwizard.com/photo/business-data-analysis-overlaid-on-urban-skyline/15b49c86fae6fe61ef76910e30625adc/>PikWizard</a>
</span>
</span>
<span class="image-link">
<span
style="margin: 0 0 20px 0; display: inline-block; vertical-align: middle; width: 100%;"
>
<a
target="_blank"
href="https://pikwizard.com/photo/business-data-analysis-overlaid-on-urban-skyline/15b49c86fae6fe61ef76910e30625adc/"
style="text-decoration: none; font-size: 10px; margin: 0;"
>
<img src="https://pikwizard.com/pw/medium/15b49c86fae6fe61ef76910e30625adc.jpg" style="margin: 0; width: 100%;" alt="" />
<p style="font-size: 12px; margin: 0;">PikWizard</p>
</a>
</span>
</span>
Free (free of charge)
Free for personal and commercial use.
Author: Creative Art
Similar Free Stock Images
Loading...

Premium


Premium


Premium


Premium


Premium

Premium

Premium

Premium


Premium


Premium


Premium


Premium


Premium


Premium


Premium


Premium


Premium


Premium


Premium

Premium

Premium


Premium

Premium


Premium


Premium