- Home >
- Stock Photos >
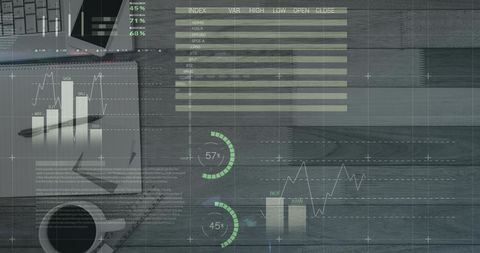
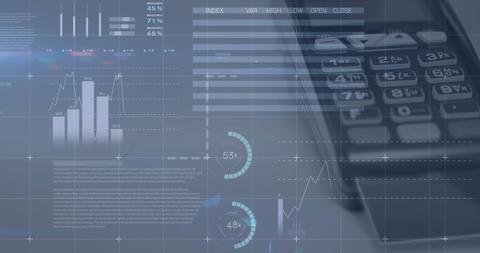
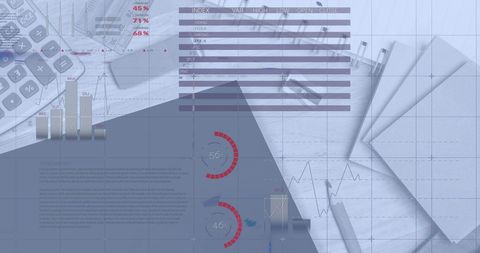
- Business Data Analysis with Financial Calculator and Charts Overlay
Business Data Analysis with Financial Calculator and Charts Overlay Image

Depicts the integration of business analytics with a technological emphasis, where financial data and economic indicators are visualized using digital interfaces. Useful for financial presentations, business strategy sessions, or educational publications discussing economic trends, corporate finance solutions, or data-driven business decision-making.
Powered by 


downloads
Tags:
More
Credit Photo
If you would like to credit the Photo, here are some ways you can do so
Text Link
photo Link
<span class="text-link">
<span>
<a target="_blank" href=https://pikwizard.com/photo/business-data-analysis-with-financial-calculator-and-charts-overlay/e9bc316bb513697f9668dc4f809e1d86/>PikWizard</a>
</span>
</span>
<span class="image-link">
<span
style="margin: 0 0 20px 0; display: inline-block; vertical-align: middle; width: 100%;"
>
<a
target="_blank"
href="https://pikwizard.com/photo/business-data-analysis-with-financial-calculator-and-charts-overlay/e9bc316bb513697f9668dc4f809e1d86/"
style="text-decoration: none; font-size: 10px; margin: 0;"
>
<img src="https://pikwizard.com/pw/medium/e9bc316bb513697f9668dc4f809e1d86.jpg" style="margin: 0; width: 100%;" alt="" />
<p style="font-size: 12px; margin: 0;">PikWizard</p>
</a>
</span>
</span>
Free (free of charge)
Free for personal and commercial use.
Author: People Creations
Similar Free Stock Images
Loading...
Premium


Premium


Premium


Premium


Premium


Premium


Premium


Premium


Premium


Premium


Premium


Premium


Premium


Premium


Premium


Premium


Premium


Premium


Premium


Premium


Premium


Premium


Premium


Premium


Premium