- Home >
- Stock Photos >
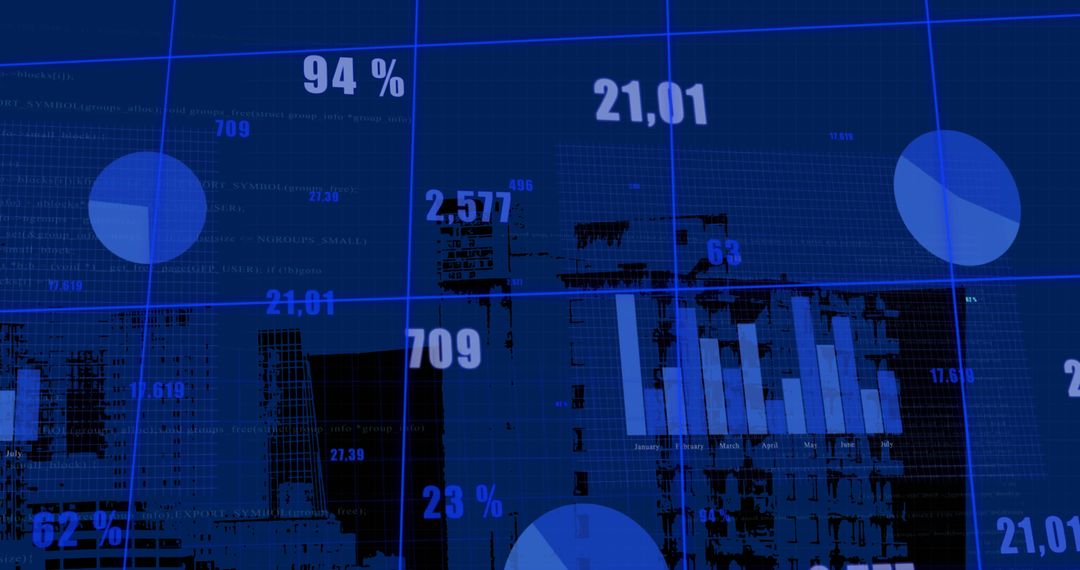
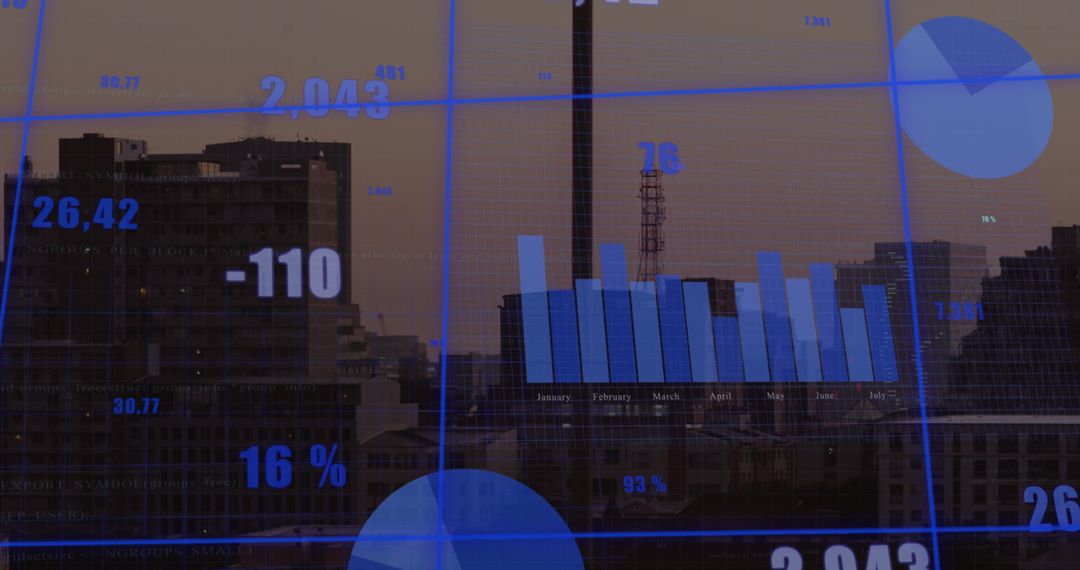
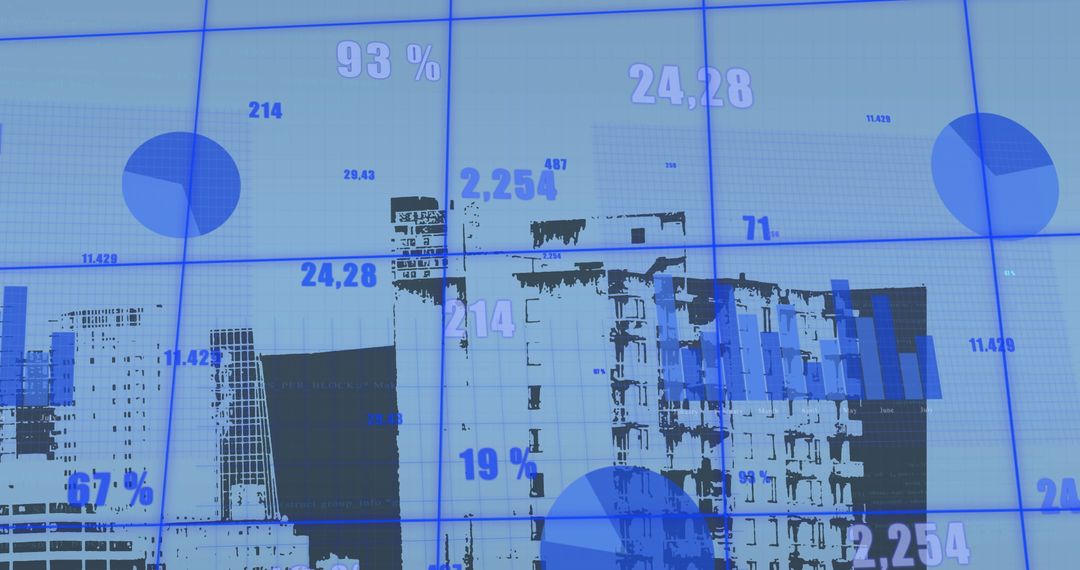
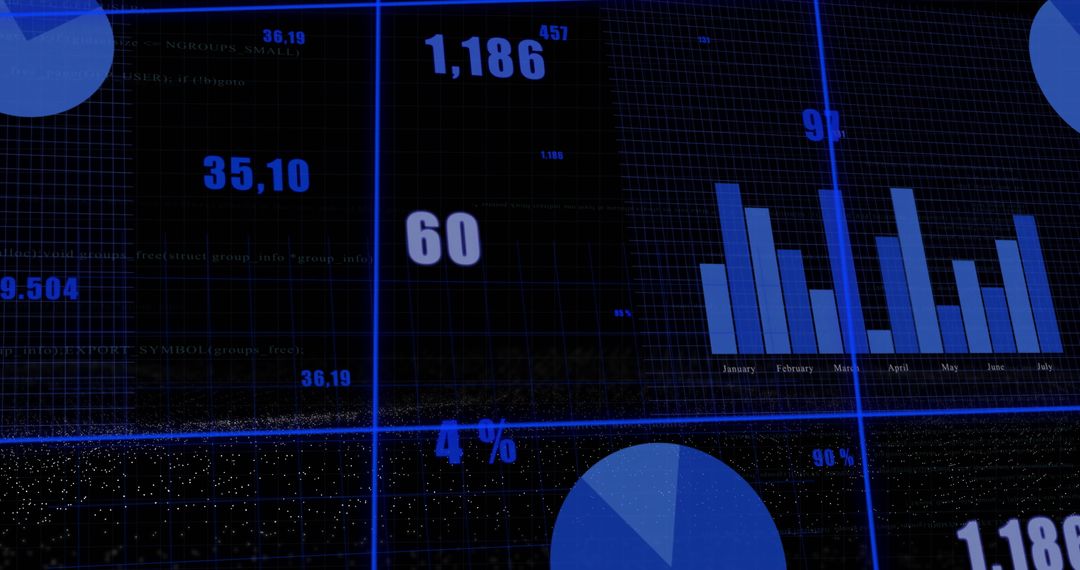
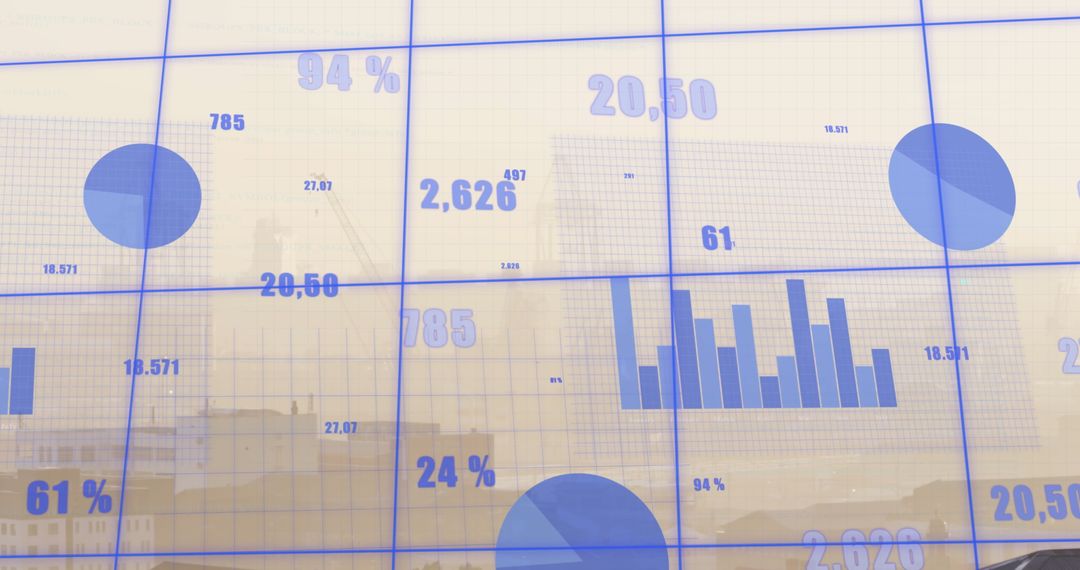
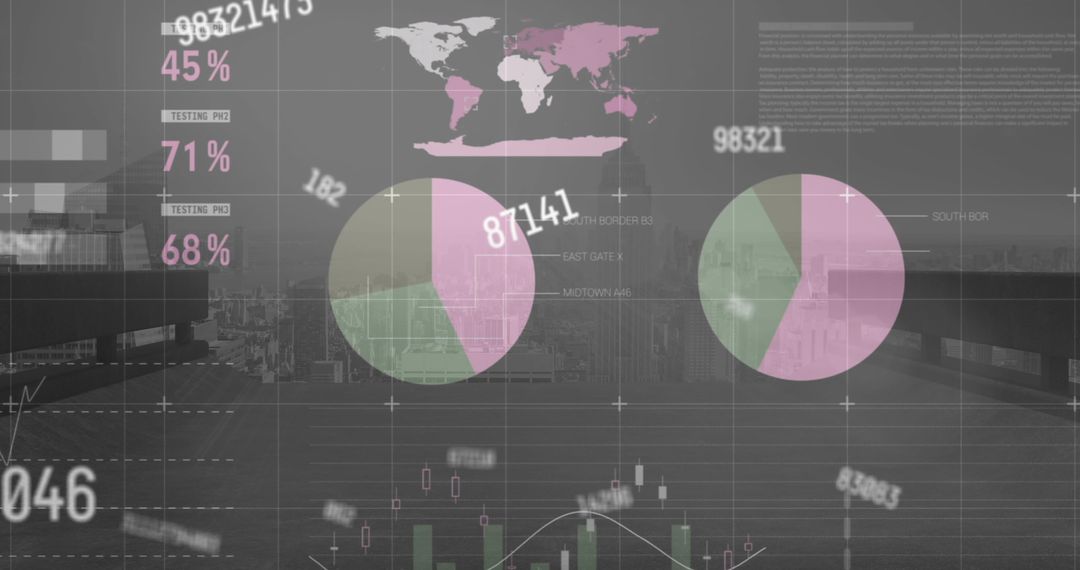
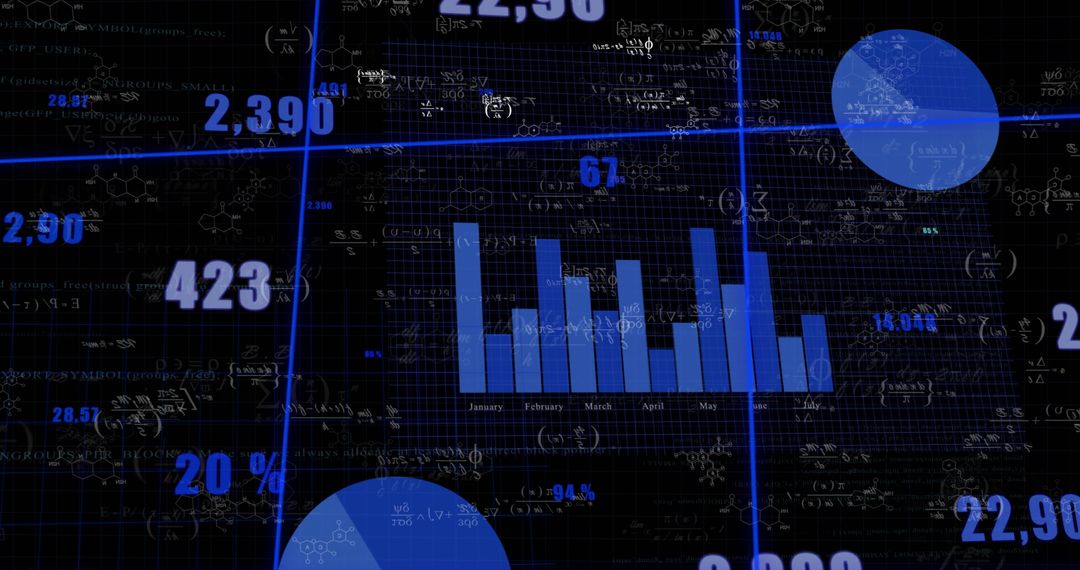
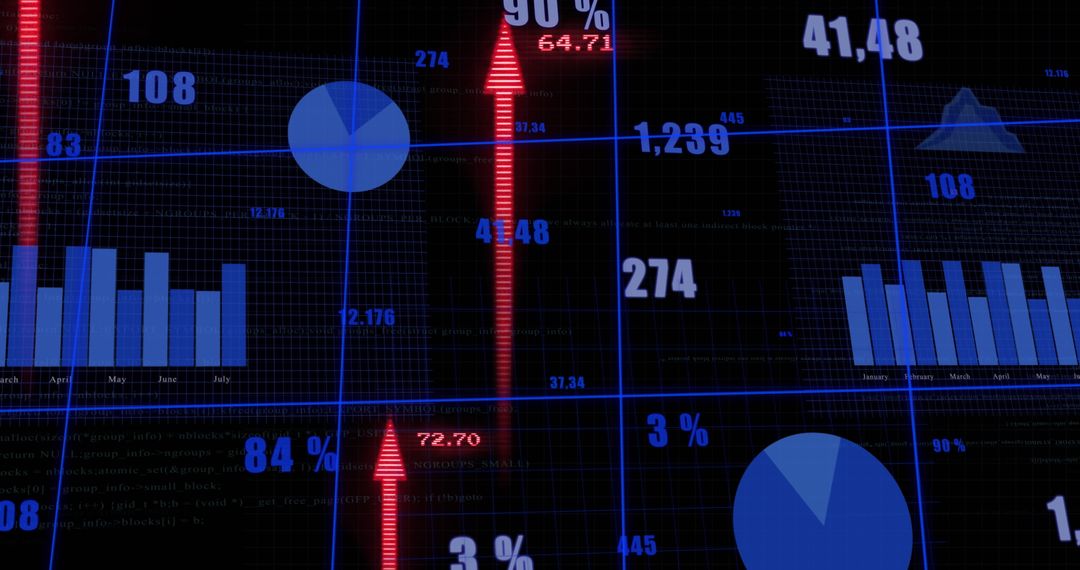
- Business Data Technology Against Luminous Background
Business Data Technology Against Luminous Background Image

Visual representation of data analytics with modern graphs and statistical charts merging onto a network grid design. Bright spots of light merge with dark background conveying innovation and digital advancement. Useful for visuals centered on digital KPIs, technological advances in financial sectors, and growth analysis.
Powered by  - Get 15% off with code: PIKWIZARD15


0
downloads
downloads
Tags:
More
Credit Photo
If you would like to credit the Photo, here are some ways you can do so
Text Link
photo Link
<span class="text-link">
<span>
<a target="_blank" href=https://pikwizard.com/photo/business-data-technology-against-luminous-background/788fff9c8e51d6a443c4761d05c5913b/>PikWizard</a>
</span>
</span>
<span class="image-link">
<span
style="margin: 0 0 20px 0; display: inline-block; vertical-align: middle; width: 100%;"
>
<a
target="_blank"
href="https://pikwizard.com/photo/business-data-technology-against-luminous-background/788fff9c8e51d6a443c4761d05c5913b/"
style="text-decoration: none; font-size: 10px; margin: 0;"
>
<img src="https://pikwizard.com/pw/medium/788fff9c8e51d6a443c4761d05c5913b.jpg" style="margin: 0; width: 100%;" alt="" />
<p style="font-size: 12px; margin: 0;">PikWizard</p>
</a>
</span>
</span>
Free (free of charge)
Free for personal and commercial use.
Author: Authentic Images
Similar Free Stock Images

Premium


Premium


Premium


Premium


Premium


Premium


Premium


Premium


Premium


Premium


Premium


Premium


Premium


Premium


Premium


Premium


Premium


Premium


Premium


Premium


Premium


Premium


Premium


Premium