- Home >
- Stock Photos >
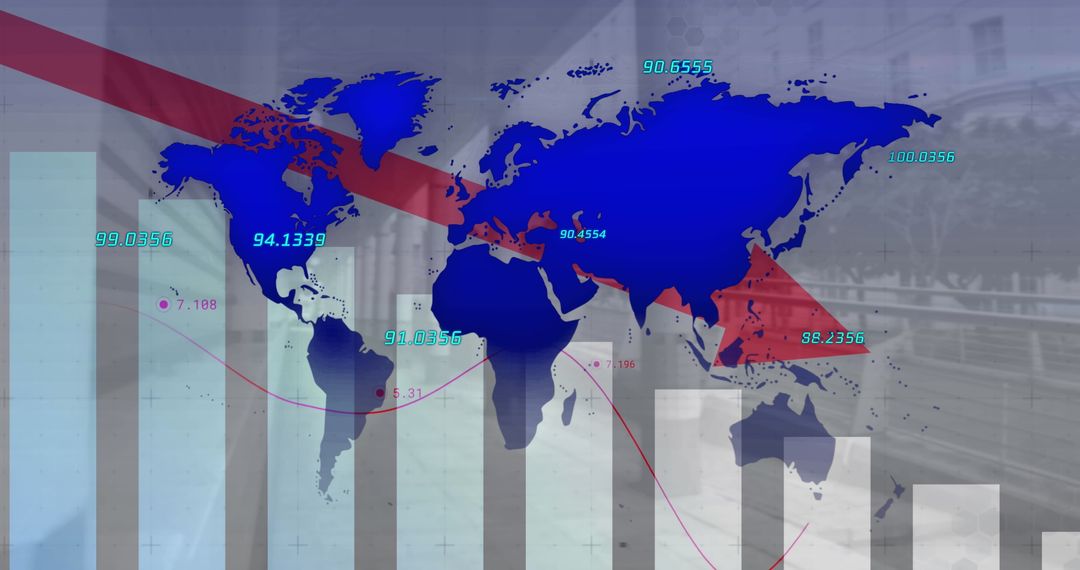
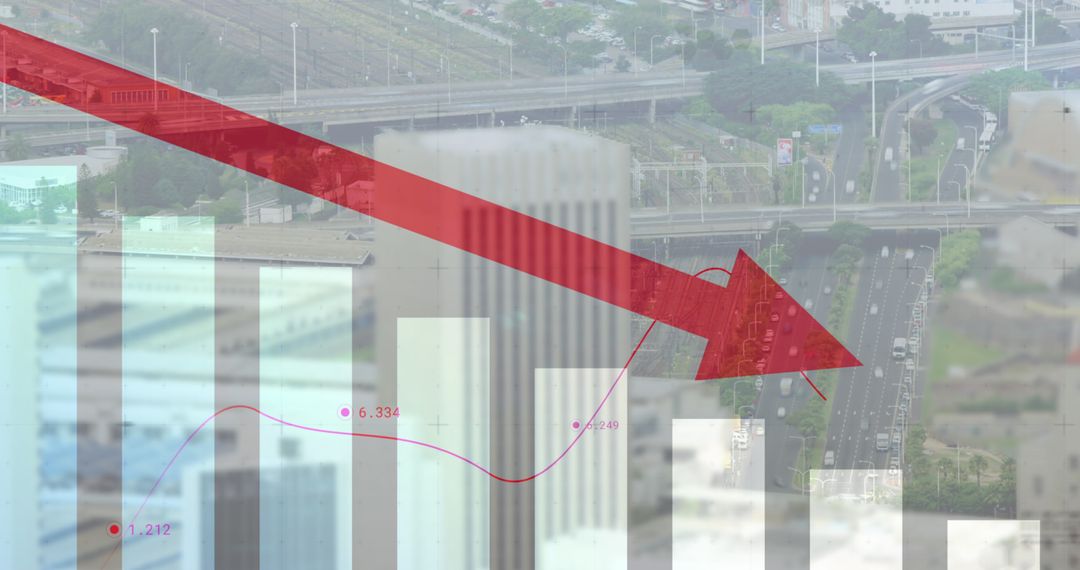
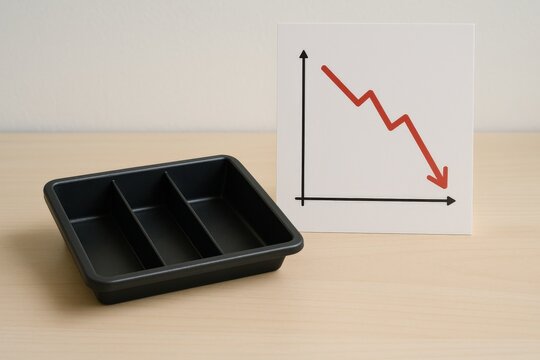
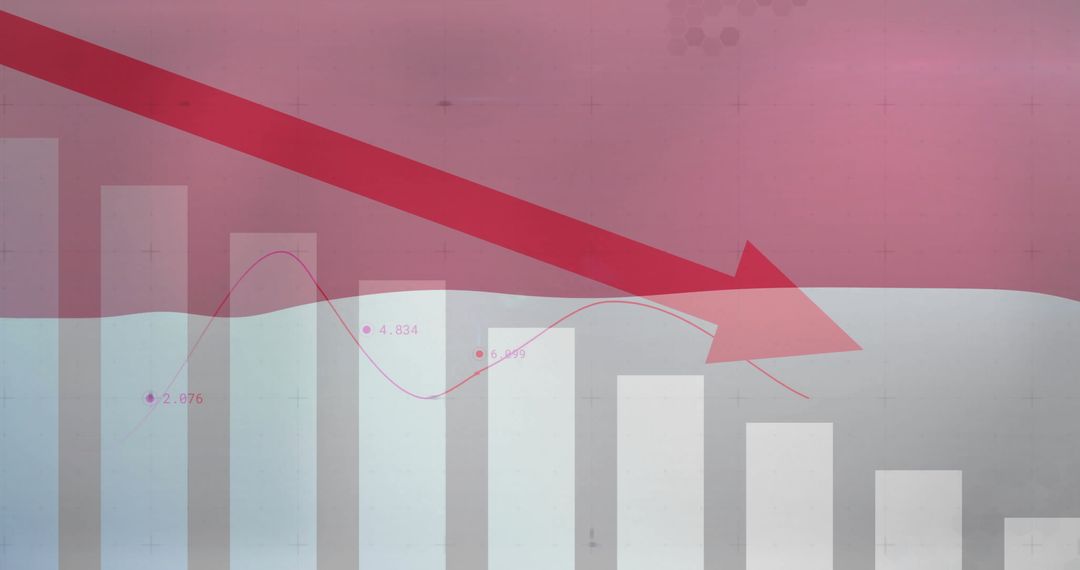
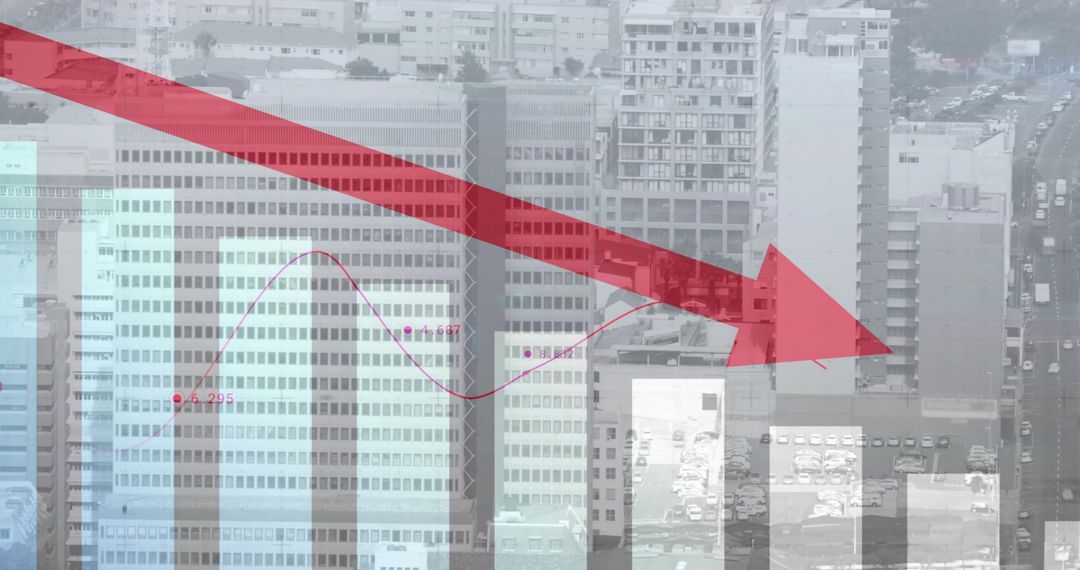
- Business Financial Decline Representation with Arrow Overlapping Graphs
Business Financial Decline Representation with Arrow Overlapping Graphs Image

The use of a large red arrow signaling downwards glossed over monochrome bar and line graphs provides a striking conceptual representation of economic decline, making it valuable for groups tracking global markets or briefing downturn implications—it considerably encapsulates Celtic sentimets elucidately officers explaining patrons Deus chamber subsidiaries highlightedbiz practical dossiers.
Powered by 


2
downloads
downloads
Tags:
More
Credit Photo
If you would like to credit the Photo, here are some ways you can do so
Text Link
photo Link
<span class="text-link">
<span>
<a target="_blank" href=https://pikwizard.com/photo/business-financial-decline-representation-with-arrow-overlapping-graphs/9e5bc0fb9638c8ed30a10b7697dc08a9/>PikWizard</a>
</span>
</span>
<span class="image-link">
<span
style="margin: 0 0 20px 0; display: inline-block; vertical-align: middle; width: 100%;"
>
<a
target="_blank"
href="https://pikwizard.com/photo/business-financial-decline-representation-with-arrow-overlapping-graphs/9e5bc0fb9638c8ed30a10b7697dc08a9/"
style="text-decoration: none; font-size: 10px; margin: 0;"
>
<img src="https://pikwizard.com/pw/medium/9e5bc0fb9638c8ed30a10b7697dc08a9.jpg" style="margin: 0; width: 100%;" alt="" />
<p style="font-size: 12px; margin: 0;">PikWizard</p>
</a>
</span>
</span>
Free (free of charge)
Free for personal and commercial use.
Author: People Creations
Similar Free Stock Images

Premium


Premium


Premium


Premium


Premium


Premium


Premium


Premium