- Home >
- Stock Photos >
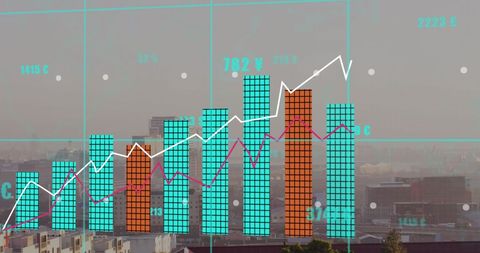
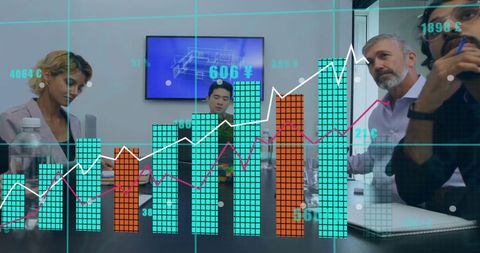
- Business Growth Graph in Modern Empty Office Background
Business Growth Graph in Modern Empty Office Background Image

Dynamic representation of a rising bar graph and analytic data in a modern and empty office setting. Reflects trends in business performance, economic growth, and strategic planning in a minimalistic and tech-savvy workspace. Useful for presentations related to business forecasting, financial reports, corporate growth strategies, or digital analytics discussions.
Powered by 


downloads
Tags:
More
Credit Photo
If you would like to credit the Photo, here are some ways you can do so
Text Link
photo Link
<span class="text-link">
<span>
<a target="_blank" href=https://pikwizard.com/photo/business-growth-graph-in-modern-empty-office-background/acf0af2580e0e0f7f7247cbf81716d5e/>PikWizard</a>
</span>
</span>
<span class="image-link">
<span
style="margin: 0 0 20px 0; display: inline-block; vertical-align: middle; width: 100%;"
>
<a
target="_blank"
href="https://pikwizard.com/photo/business-growth-graph-in-modern-empty-office-background/acf0af2580e0e0f7f7247cbf81716d5e/"
style="text-decoration: none; font-size: 10px; margin: 0;"
>
<img src="https://pikwizard.com/pw/medium/acf0af2580e0e0f7f7247cbf81716d5e.jpg" style="margin: 0; width: 100%;" alt="" />
<p style="font-size: 12px; margin: 0;">PikWizard</p>
</a>
</span>
</span>
Free (free of charge)
Free for personal and commercial use.
Author: Creative Art
Similar Free Stock Images
Loading...

Premium


Premium

Premium


Premium


Premium


Premium


Premium


Premium


Premium


Premium


Premium


Premium


Premium

Premium


Premium


Premium


Premium


Premium


Premium


Premium


Premium


Premium


Premium


Premium

Premium