- Home >
- Stock Photos >
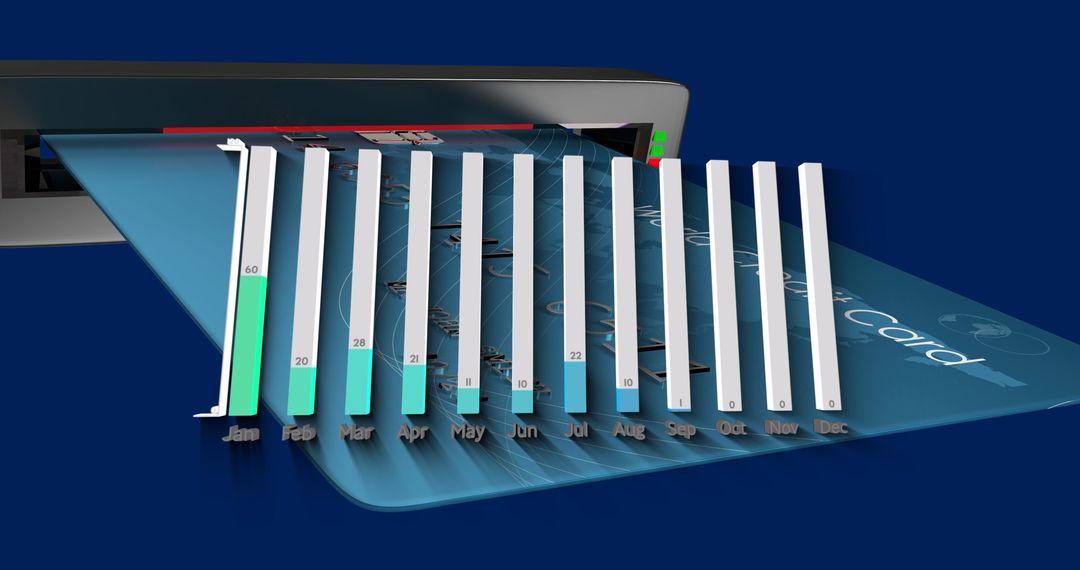
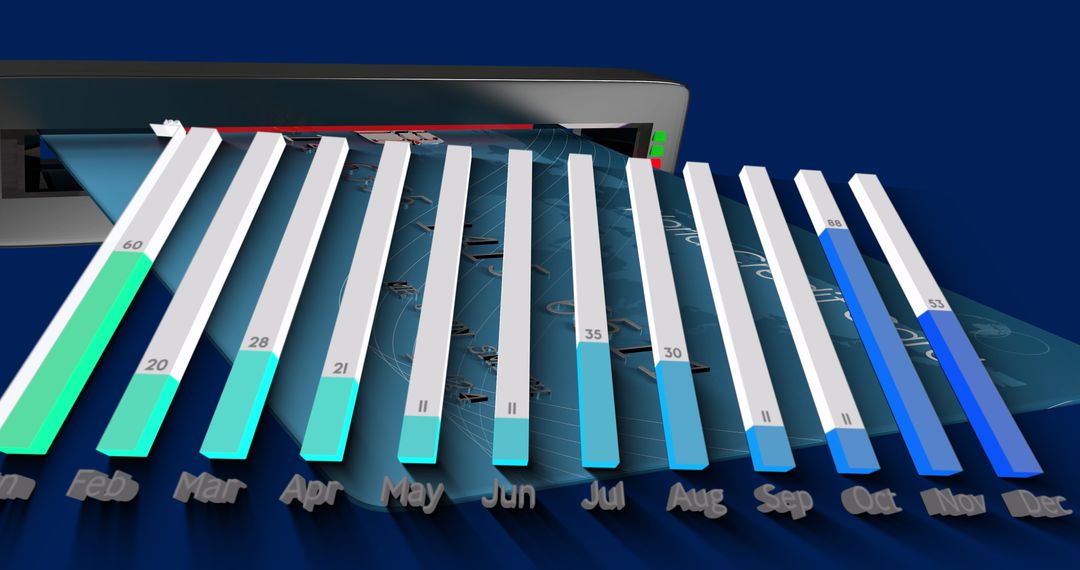
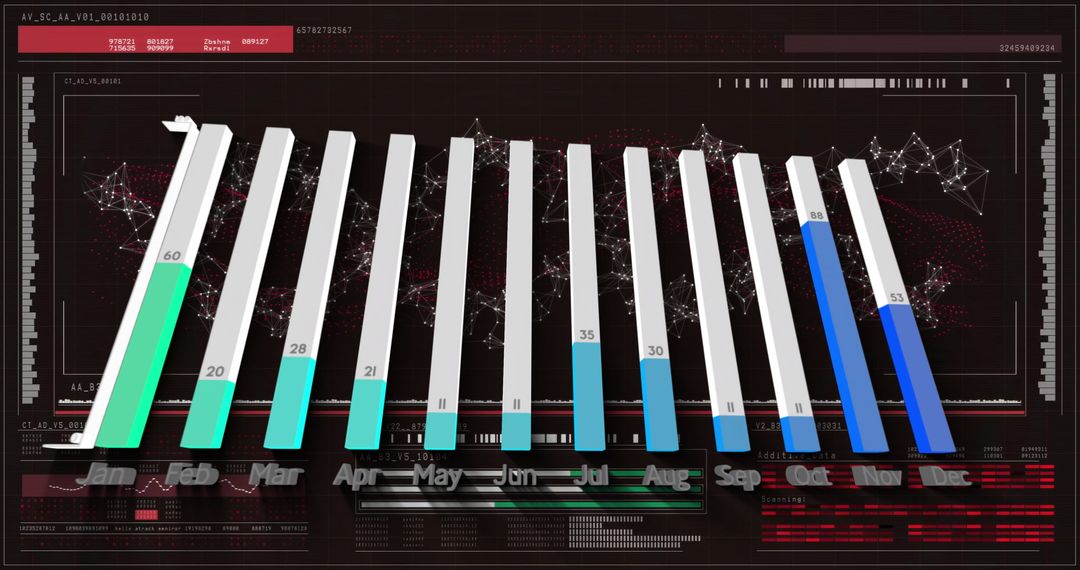
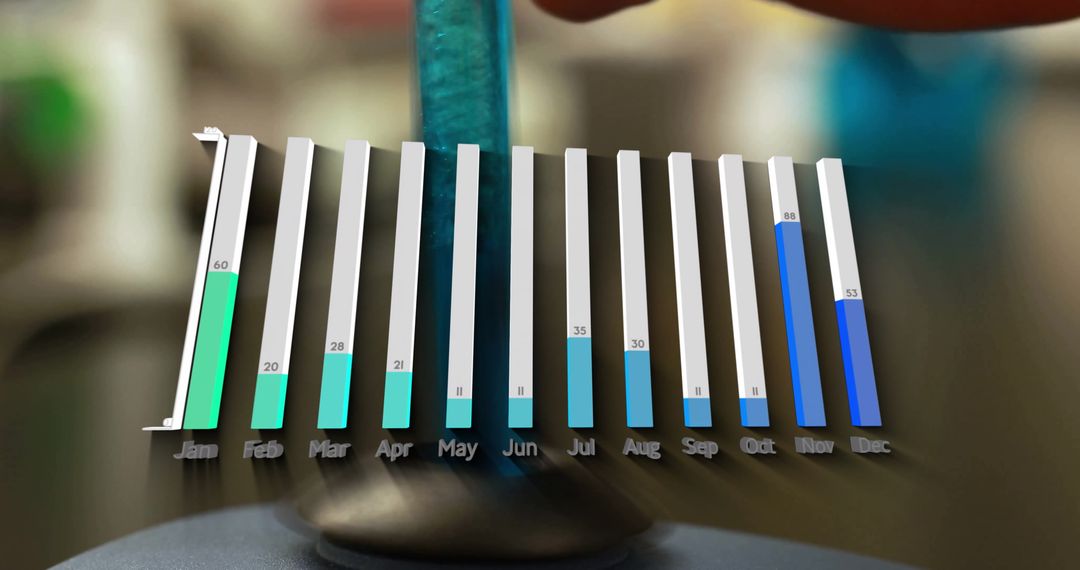
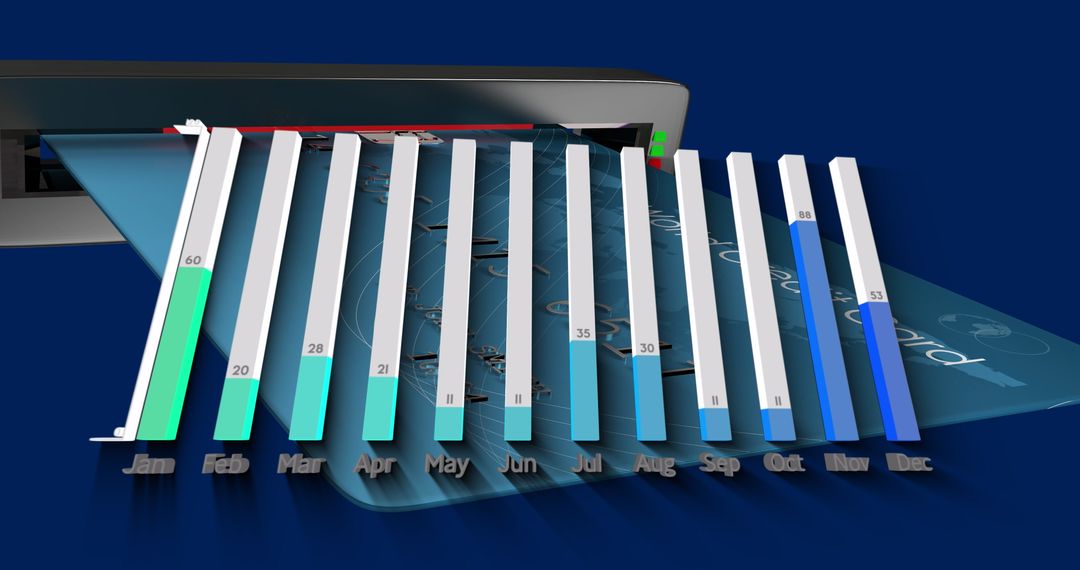
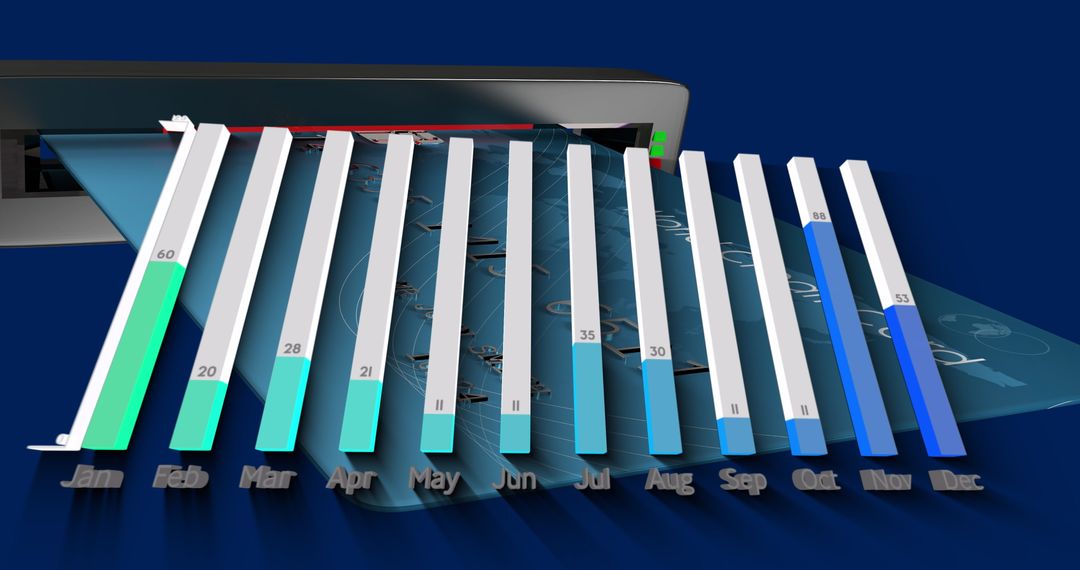
- Business Growth Technology Conceptual Design with Graphs
Business Growth Technology Conceptual Design with Graphs Image
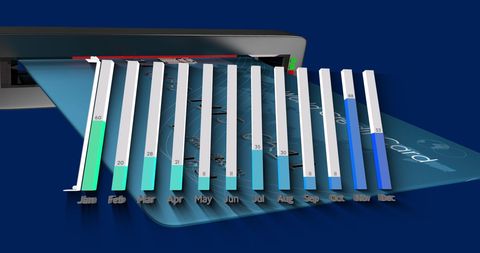
Concept imagery depicting business growth and analytics using a futuristic style with holographic elements. Useful for illustrating concepts in technology-driven business strategies, financial planning, and data analysis presentations.
Powered by 


4
downloads
downloads
Credit Photo
If you would like to credit the Photo, here are some ways you can do so
Text Link
photo Link
<span class="text-link">
<span>
<a target="_blank" href=https://pikwizard.com/photo/business-growth-technology-conceptual-design-with-graphs/cd0e65bb6742b5a78bf72d0746e09b8f/>PikWizard</a>
</span>
</span>
<span class="image-link">
<span
style="margin: 0 0 20px 0; display: inline-block; vertical-align: middle; width: 100%;"
>
<a
target="_blank"
href="https://pikwizard.com/photo/business-growth-technology-conceptual-design-with-graphs/cd0e65bb6742b5a78bf72d0746e09b8f/"
style="text-decoration: none; font-size: 10px; margin: 0;"
>
<img src="https://pikwizard.com/pw/medium/cd0e65bb6742b5a78bf72d0746e09b8f.jpg" style="margin: 0; width: 100%;" alt="" />
<p style="font-size: 12px; margin: 0;">PikWizard</p>
</a>
</span>
</span>
Free (free of charge)
Free for personal and commercial use.
Author: People Creations
Similar Free Stock Images

Premium


Premium


Premium


Premium


Premium


Premium


Premium


Premium


Premium


Premium


Premium


Premium


Premium


Premium


Premium


Premium


Premium


Premium


Premium


Premium


Premium


Premium


Premium


Premium