- Home >
- Stock Photos >
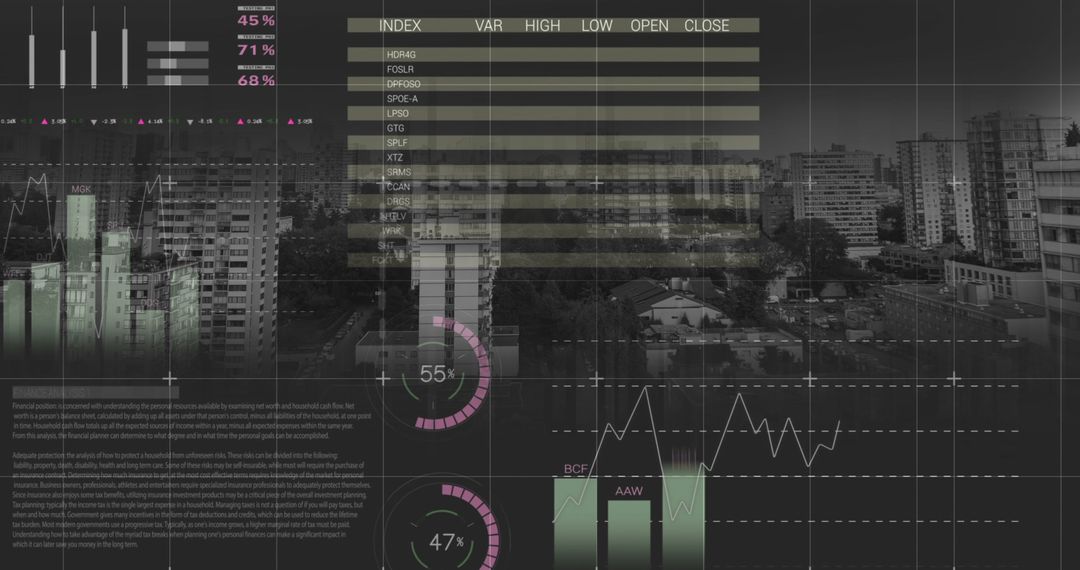
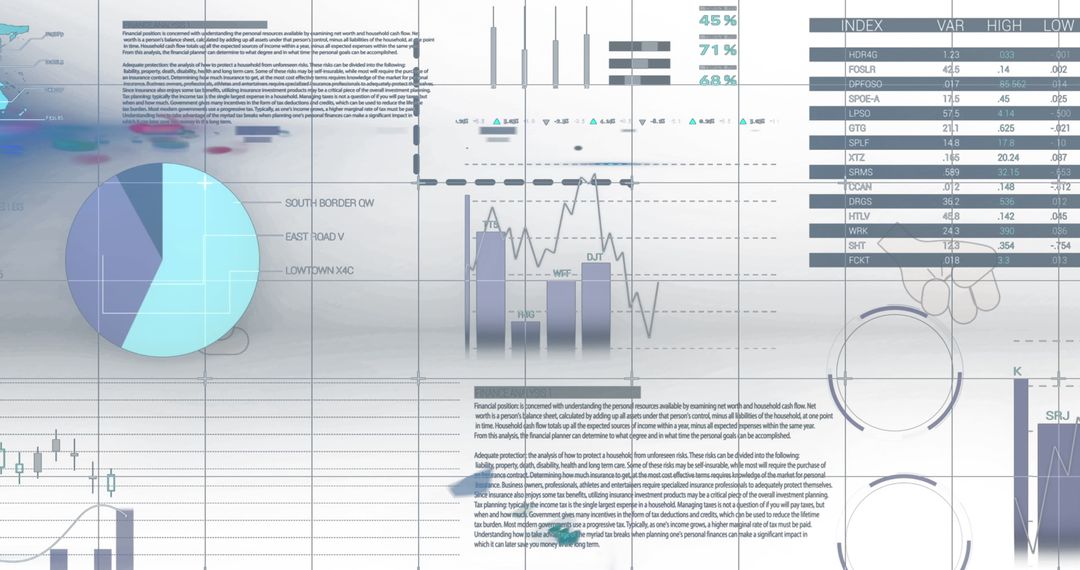
- Business Overview with Infographics and Financial Data Analytics
Business Overview with Infographics and Financial Data Analytics Image

Dynamic composition with statistical graphics overlayed with financial analytics charts on blurred background of business professionals. Ideal for illustrating concepts in data-driven decision making, stock market analysis, and global business strategy presentations. Suitable for use in presentations, reports, and as illustrative content in finance-related articles.
Powered by  - Get 15% off with code: PIKWIZARD15


3
downloads
downloads
Tags:
More
Credit Photo
If you would like to credit the Photo, here are some ways you can do so
Text Link
photo Link
<span class="text-link">
<span>
<a target="_blank" href=https://pikwizard.com/photo/business-overview-with-infographics-and-financial-data-analytics/849a44740cab82b90be89e91a3b218af/>PikWizard</a>
</span>
</span>
<span class="image-link">
<span
style="margin: 0 0 20px 0; display: inline-block; vertical-align: middle; width: 100%;"
>
<a
target="_blank"
href="https://pikwizard.com/photo/business-overview-with-infographics-and-financial-data-analytics/849a44740cab82b90be89e91a3b218af/"
style="text-decoration: none; font-size: 10px; margin: 0;"
>
<img src="https://pikwizard.com/pw/medium/849a44740cab82b90be89e91a3b218af.jpg" style="margin: 0; width: 100%;" alt="" />
<p style="font-size: 12px; margin: 0;">PikWizard</p>
</a>
</span>
</span>
Free (free of charge)
Free for personal and commercial use.
Author: Creative Art
Similar Free Stock Images

Premium


Premium


Premium


Premium


Premium


Premium


Premium


Premium


Premium


Premium


Premium


Premium


Premium


Premium


Premium


Premium


Premium


Premium


Premium


Premium


Premium


Premium


Premium


Premium