
- Home >
- Stock Photos >
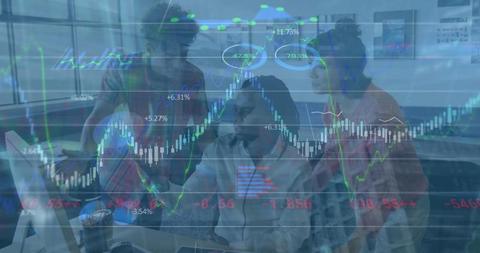
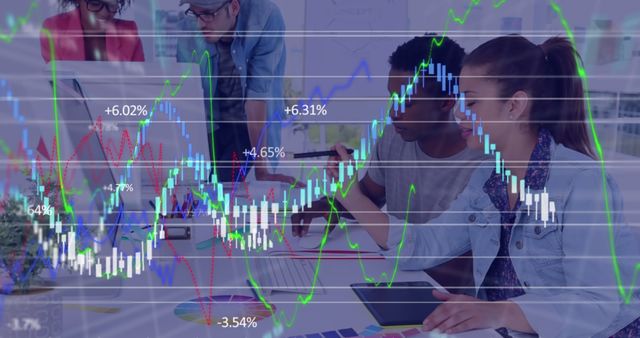
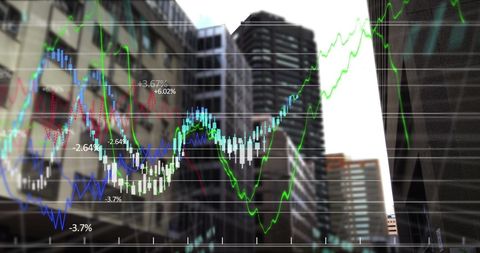
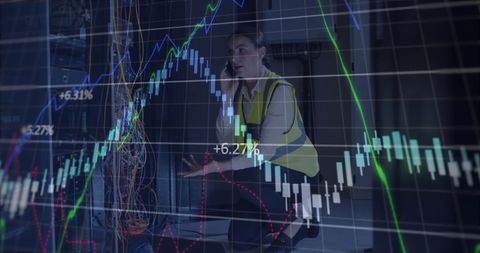
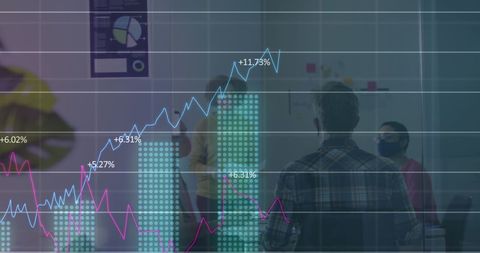
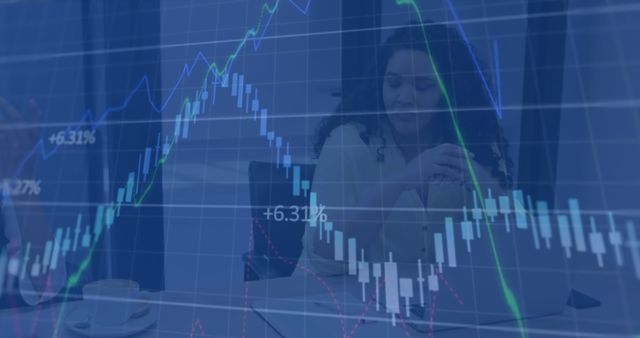
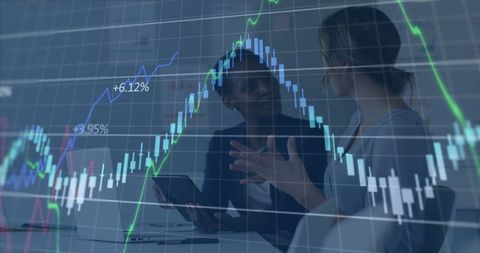
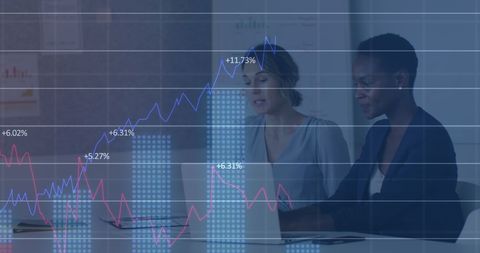
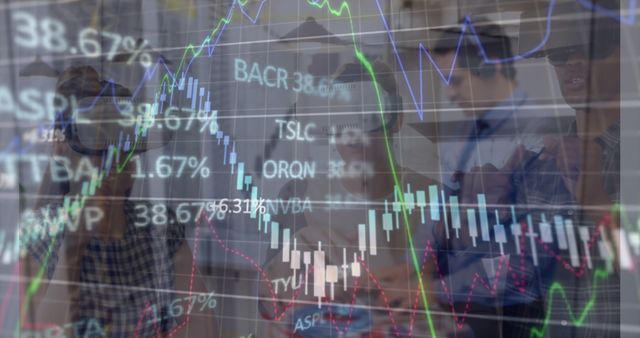
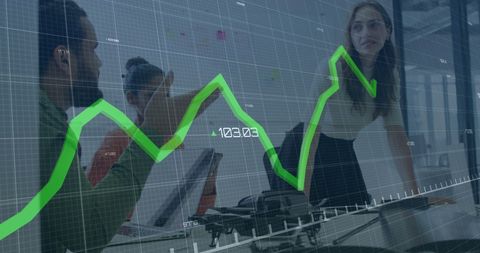
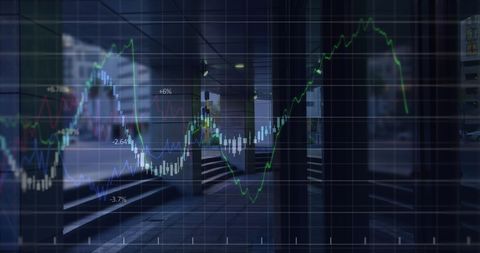
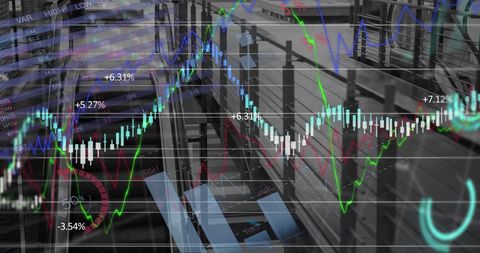
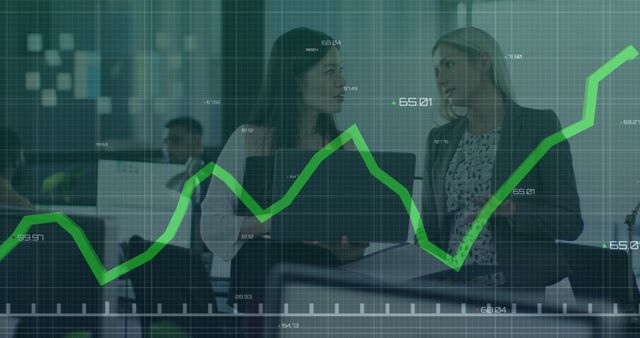
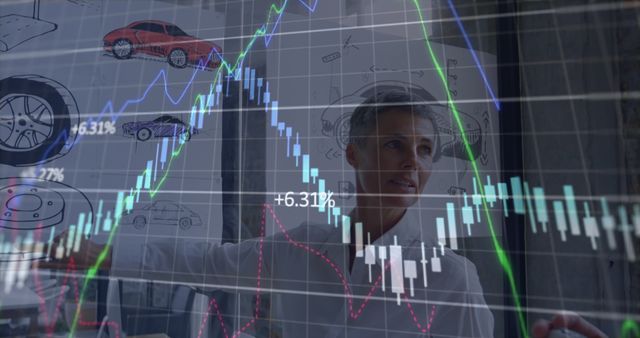
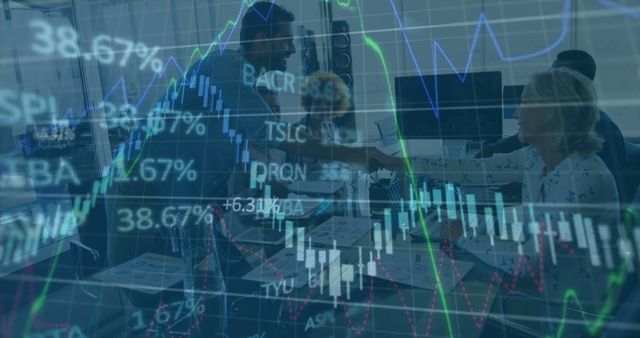
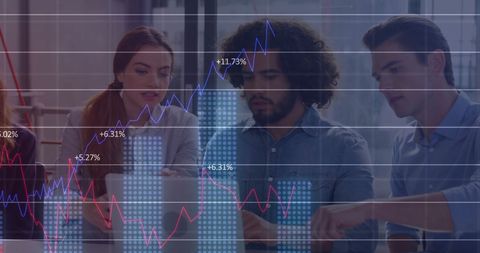
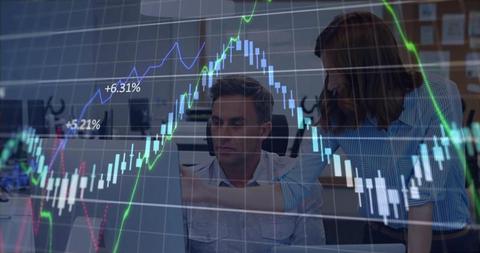
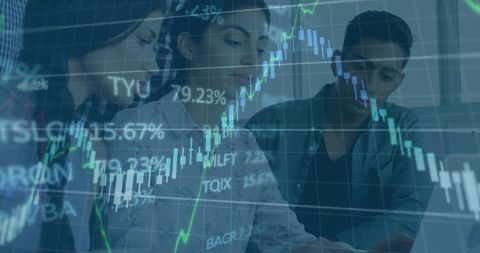
- Business People Analyzing Complex Financial Data Charts
Business People Analyzing Complex Financial Data Charts Image
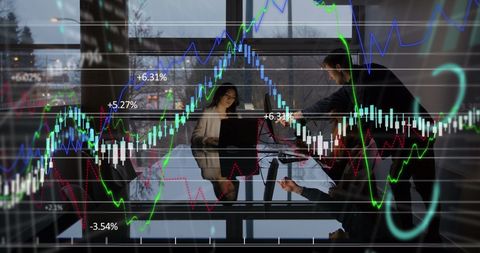
Business professionals collaborate on analyzing complex financial data with multiple charts superimposed, symbolizing their focus on stock market trends and advanced data processing. Ideal for use in corporate presentations, financial reports, and educational materials on global trading and business strategies.
Powered by  - Get 15% off with code: PIKWIZARD15


downloads
Tags:
More
Credit Photo
If you would like to credit the Photo, here are some ways you can do so
Text Link
photo Link
<span class="text-link">
<span>
<a target="_blank" href=https://pikwizard.com/photo/business-people-analyzing-complex-financial-data-charts/101a5116aaf7f21bc56d8a9d27d76abb/>PikWizard</a>
</span>
</span>
<span class="image-link">
<span
style="margin: 0 0 20px 0; display: inline-block; vertical-align: middle; width: 100%;"
>
<a
target="_blank"
href="https://pikwizard.com/photo/business-people-analyzing-complex-financial-data-charts/101a5116aaf7f21bc56d8a9d27d76abb/"
style="text-decoration: none; font-size: 10px; margin: 0;"
>
<img src="https://pikwizard.com/pw/medium/101a5116aaf7f21bc56d8a9d27d76abb.jpg" style="margin: 0; width: 100%;" alt="" />
<p style="font-size: 12px; margin: 0;">PikWizard</p>
</a>
</span>
</span>
Free (free of charge)
Free for personal and commercial use.
Author: Creative Art
Similar Free Stock Images

Premium


Premium


Premium


Premium


Premium


Premium


Premium

Premium

Premium


Premium


Premium

Premium

Premium


Premium


Premium


Premium

Premium


Premium


Premium


Premium


Premium


Premium


Premium


Premium


Premium


Explore More Free Stock Images