
- Home >
- Stock Photos >
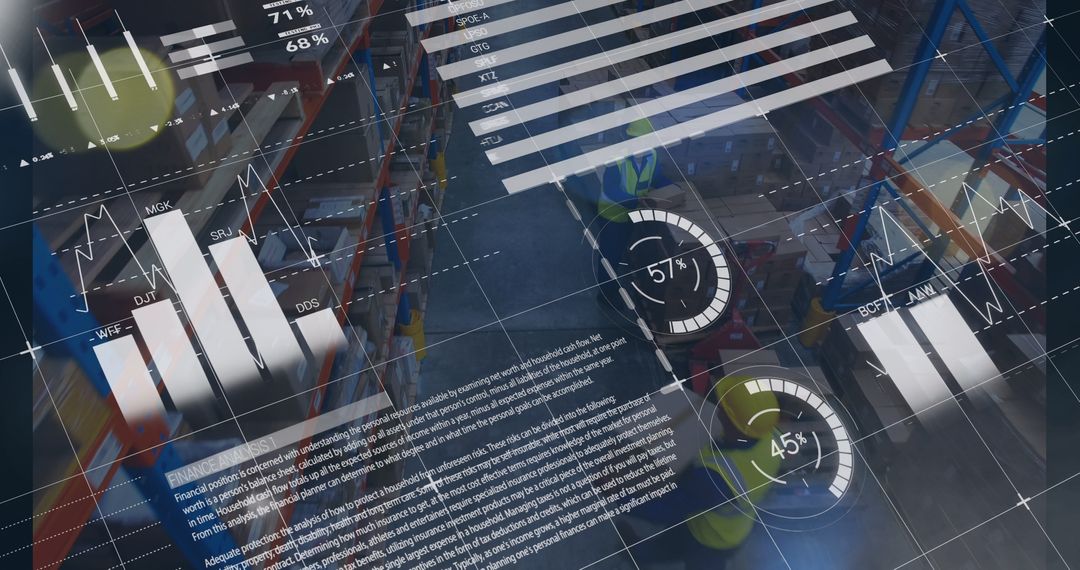
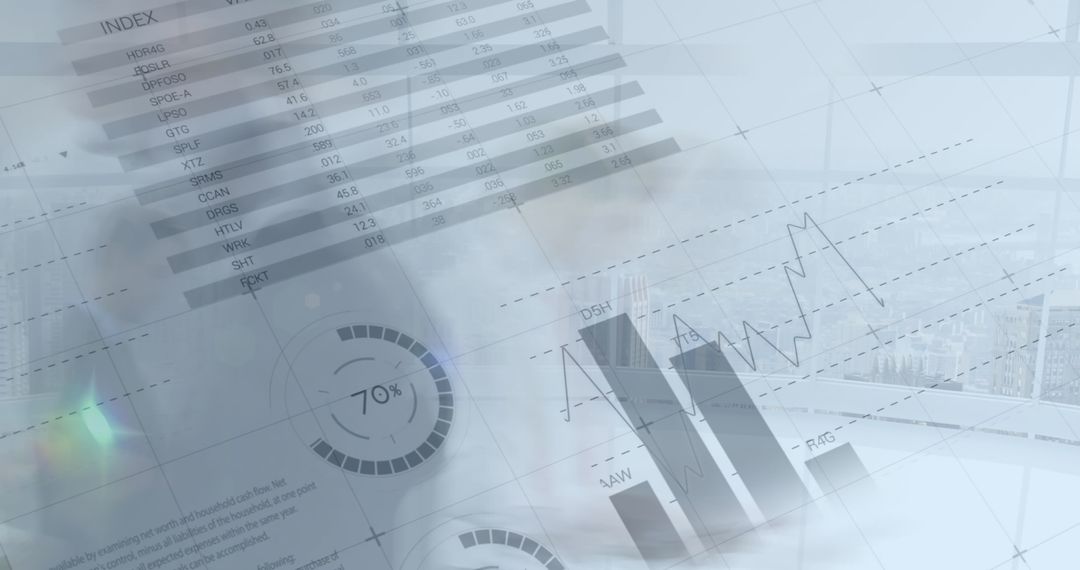
- Business People Walking with Overlay of Financial Charts and Data
Business People Walking with Overlay of Financial Charts and Data Image

Business professionals in motion symbolize industry dynamism, overlaid with financial charts. Designed to illustrate financial strategies, market trends, and dynamic economic discussions, this composition fits well in presentations, reports, and articles about finance.
Powered by  - Get 15% off with code: PIKWIZARD15


2
downloads
downloads
Tags:
Credit Photo
If you would like to credit the Photo, here are some ways you can do so
Text Link
photo Link
<span class="text-link">
<span>
<a target="_blank" href=https://pikwizard.com/photo/business-people-walking-with-overlay-of-financial-charts-and-data/16aa20040c5437974f149763d7df14e8/>PikWizard</a>
</span>
</span>
<span class="image-link">
<span
style="margin: 0 0 20px 0; display: inline-block; vertical-align: middle; width: 100%;"
>
<a
target="_blank"
href="https://pikwizard.com/photo/business-people-walking-with-overlay-of-financial-charts-and-data/16aa20040c5437974f149763d7df14e8/"
style="text-decoration: none; font-size: 10px; margin: 0;"
>
<img src="https://pikwizard.com/pw/medium/16aa20040c5437974f149763d7df14e8.jpg" style="margin: 0; width: 100%;" alt="" />
<p style="font-size: 12px; margin: 0;">PikWizard</p>
</a>
</span>
</span>
Free (free of charge)
Free for personal and commercial use.
Author: Authentic Images
Similar Free Stock Images

Premium


Premium


Premium


Premium


Premium


Premium


Premium


Premium


Premium


Premium


Premium


Premium


Premium


Premium


Premium


Premium


Premium


Premium


Premium


Premium


Premium


Premium


Premium


Premium

