- Home >
- Stock Photos >
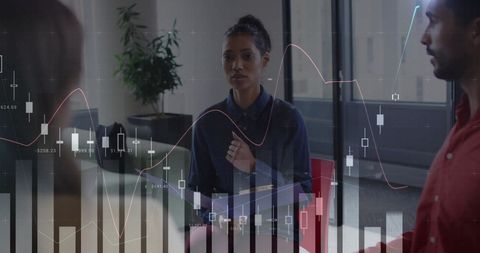
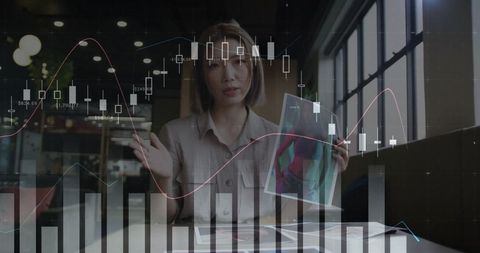
- Business Professional Analyzing Data with Graphs and COVID-19 Interface
Business Professional Analyzing Data with Graphs and COVID-19 Interface Image

Business professional focused on analyzing market data with an overlay of graphs and statistics. The presence of COVID-19 graphical interface portrays the influence of the pandemic on financial analysis and decision-making. Useful for illustrating concepts related to business strategy during challenging times, economic impacts of COVID-19, or technological advancements in data analytics.
Powered by  - Get 15% off with code: PIKWIZARD15


2
downloads
downloads
Tags:
More
Credit Photo
If you would like to credit the Photo, here are some ways you can do so
Text Link
photo Link
<span class="text-link">
<span>
<a target="_blank" href=https://pikwizard.com/photo/business-professional-analyzing-data-with-graphs-and-covid-19-interface/480abd587de71d8cd93efddcf9b70744/>PikWizard</a>
</span>
</span>
<span class="image-link">
<span
style="margin: 0 0 20px 0; display: inline-block; vertical-align: middle; width: 100%;"
>
<a
target="_blank"
href="https://pikwizard.com/photo/business-professional-analyzing-data-with-graphs-and-covid-19-interface/480abd587de71d8cd93efddcf9b70744/"
style="text-decoration: none; font-size: 10px; margin: 0;"
>
<img src="https://pikwizard.com/pw/medium/480abd587de71d8cd93efddcf9b70744.jpg" style="margin: 0; width: 100%;" alt="" />
<p style="font-size: 12px; margin: 0;">PikWizard</p>
</a>
</span>
</span>
Free (free of charge)
Free for personal and commercial use.
Author: People Creations
Similar Free Stock Images
Loading...

Premium


Premium


Premium


Premium


Premium

Premium


Premium

Premium


Premium

Premium


Premium


Premium


Premium

Premium

Premium


Premium


Premium


Premium


Premium

Premium

Premium


Premium


Premium

Premium

Premium