- Home >
- Stock Photos >
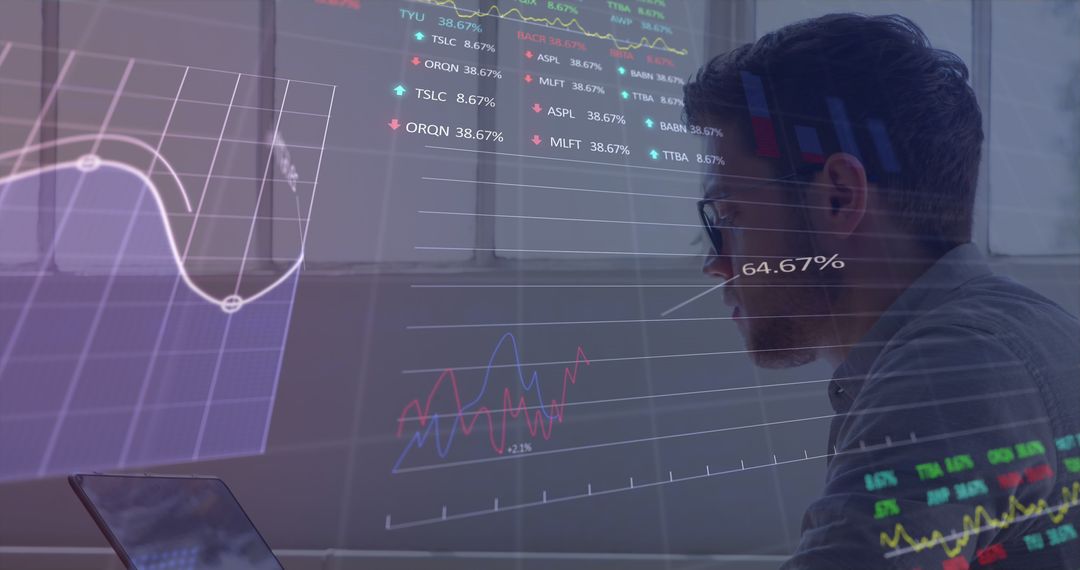
- Business Professional Analyzing Financial Data on Screen
Business Professional Analyzing Financial Data on Screen Image
This portrays a mature Caucasian male, dressed in a formal suit, deeply engaged in financial data analysis. He examines complex financial graphs on a digital screen with a focused expression. Ideal for use in corporate settings, financial services, investment strategy content, or showcasing professional dedication to financial growth.
Powered by  - Get 15% off with code: PIKWIZARD15


12
downloads
downloads
Tags:
More
Credit Photo
If you would like to credit the Photo, here are some ways you can do so
Text Link
photo Link
<span class="text-link">
<span>
<a target="_blank" href=https://pikwizard.com/photo/business-professional-analyzing-financial-data-on-screen/d29397c2b31dc480efaf5822c42f5ec9/>PikWizard</a>
</span>
</span>
<span class="image-link">
<span
style="margin: 0 0 20px 0; display: inline-block; vertical-align: middle; width: 100%;"
>
<a
target="_blank"
href="https://pikwizard.com/photo/business-professional-analyzing-financial-data-on-screen/d29397c2b31dc480efaf5822c42f5ec9/"
style="text-decoration: none; font-size: 10px; margin: 0;"
>
<img src="https://pikwizard.com/pw/medium/d29397c2b31dc480efaf5822c42f5ec9.jpg" style="margin: 0; width: 100%;" alt="" />
<p style="font-size: 12px; margin: 0;">PikWizard</p>
</a>
</span>
</span>
Free (free of charge)
Free for personal and commercial use.
Author: Awesome Content
Similar Free Stock Images

Premium


Premium


Premium


Premium


Premium


Premium


Premium


Premium


Premium


Premium


Premium


Premium


Premium


Premium


Premium


Premium


Premium


Premium


Premium


Premium


Premium


Premium


Premium


Premium