- Home >
- Stock Photos >
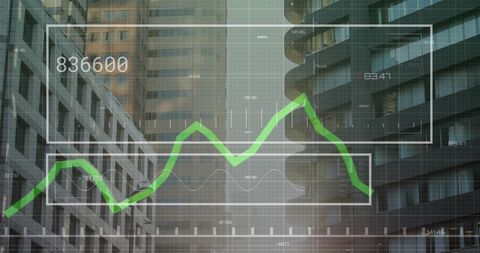
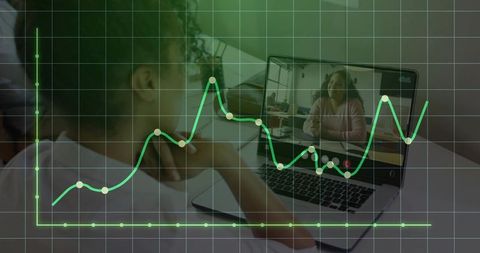
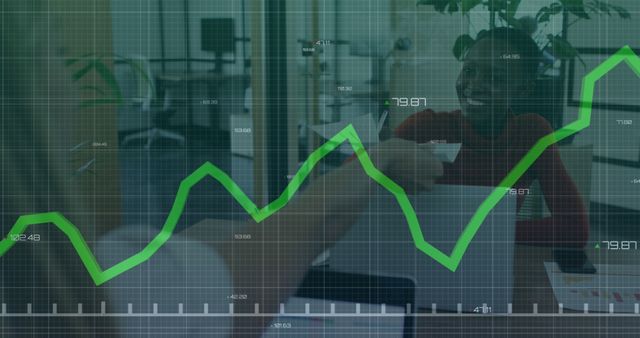
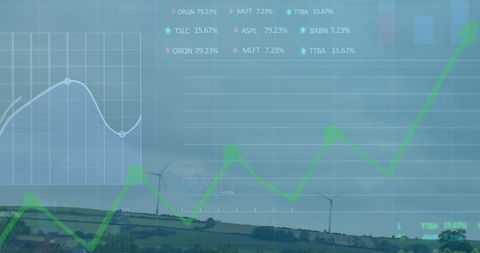
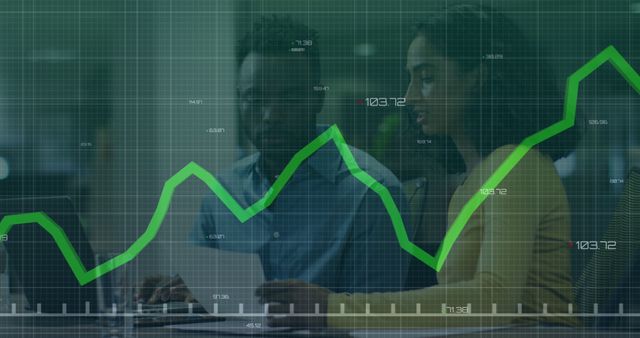
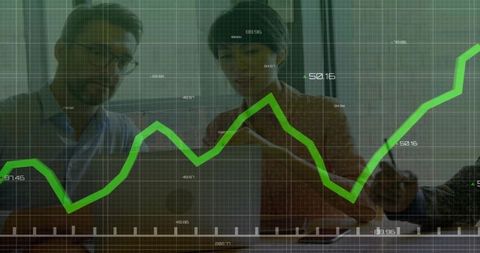
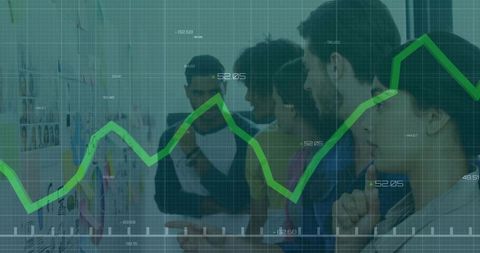
- Business Professionals Analyzing Financial Data in Conference Room
Business Professionals Analyzing Financial Data in Conference Room Image
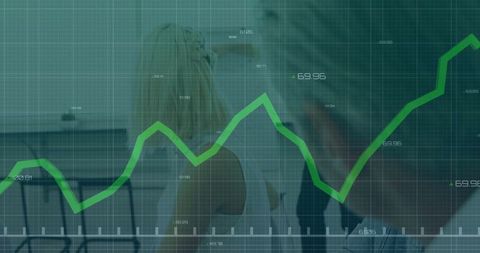
Depiction of business professionals meeting in conference room for in-depth data evaluation. Transparent line graph showing financial growth overlays office environment, symbolizing strategy planning and data-driven decision-making. Excellent for financial industry blogs, business consulting presentations, analytics software advertising, or any modern corporate report. Perfect representation of innovation-driven offices enhancing productivity and insight.
Powered by 


0
downloads
downloads
Tags:
More
Credit Photo
If you would like to credit the Photo, here are some ways you can do so
Text Link
photo Link
<span class="text-link">
<span>
<a target="_blank" href=https://pikwizard.com/photo/business-professionals-analyzing-financial-data-in-conference-room/3189c4d8321545e4bd146bb6d3ee542c/>PikWizard</a>
</span>
</span>
<span class="image-link">
<span
style="margin: 0 0 20px 0; display: inline-block; vertical-align: middle; width: 100%;"
>
<a
target="_blank"
href="https://pikwizard.com/photo/business-professionals-analyzing-financial-data-in-conference-room/3189c4d8321545e4bd146bb6d3ee542c/"
style="text-decoration: none; font-size: 10px; margin: 0;"
>
<img src="https://pikwizard.com/pw/medium/3189c4d8321545e4bd146bb6d3ee542c.jpg" style="margin: 0; width: 100%;" alt="" />
<p style="font-size: 12px; margin: 0;">PikWizard</p>
</a>
</span>
</span>
Free (free of charge)
Free for personal and commercial use.
Author: Awesome Content
Similar Free Stock Images

Premium


Premium


Premium


Premium


Premium


Premium


Premium


Premium


Premium


Premium


Premium


Premium


Premium


Premium


Premium


Premium


Premium


Premium


Premium


Premium


Premium


Premium


Premium


Premium


Premium