- Home >
- Stock Photos >
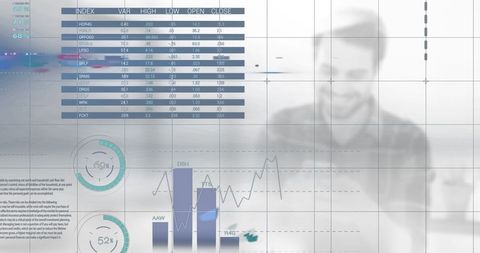
- Business Statistics Overlay with Shopping Detail in Hand
Business Statistics Overlay with Shopping Detail in Hand Image

Creative juxtaposition of business data with a woman's daily activity provides insight into markets. Perfect for topics on personal finance, market trends, big data influence on consumer choices, and economics. Useful for articles, presentations, or blogs focusing on financial impact in daily life or data science.
Powered by 


2
downloads
downloads
Tags:
More
Credit Photo
If you would like to credit the Photo, here are some ways you can do so
Text Link
photo Link
<span class="text-link">
<span>
<a target="_blank" href=https://pikwizard.com/photo/business-statistics-overlay-with-shopping-detail-in-hand/7d888ebe89e21976f3b571163252d443/>PikWizard</a>
</span>
</span>
<span class="image-link">
<span
style="margin: 0 0 20px 0; display: inline-block; vertical-align: middle; width: 100%;"
>
<a
target="_blank"
href="https://pikwizard.com/photo/business-statistics-overlay-with-shopping-detail-in-hand/7d888ebe89e21976f3b571163252d443/"
style="text-decoration: none; font-size: 10px; margin: 0;"
>
<img src="https://pikwizard.com/pw/medium/7d888ebe89e21976f3b571163252d443.jpg" style="margin: 0; width: 100%;" alt="" />
<p style="font-size: 12px; margin: 0;">PikWizard</p>
</a>
</span>
</span>
Free (free of charge)
Free for personal and commercial use.
Author: Creative Art
Similar Free Stock Images
Loading...

Premium


Premium


Premium


Premium


Premium

Premium


Premium


Premium


Premium


Premium


Premium


Premium


Premium


Premium


Premium

Premium

Premium


Premium

Premium


Premium


Premium

Premium


Premium


Premium


Premium