
- Home >
- Stock Photos >
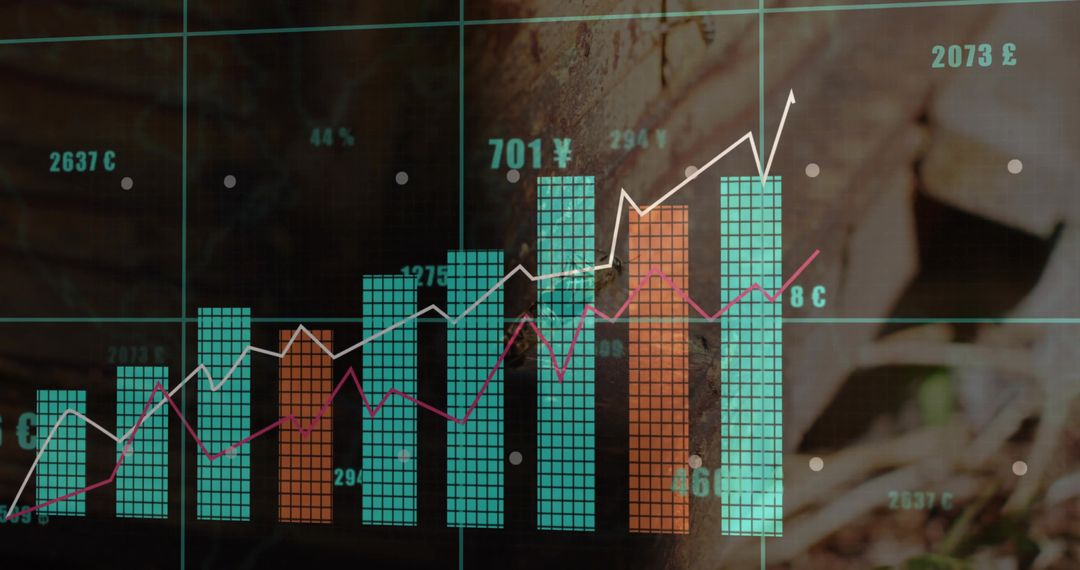
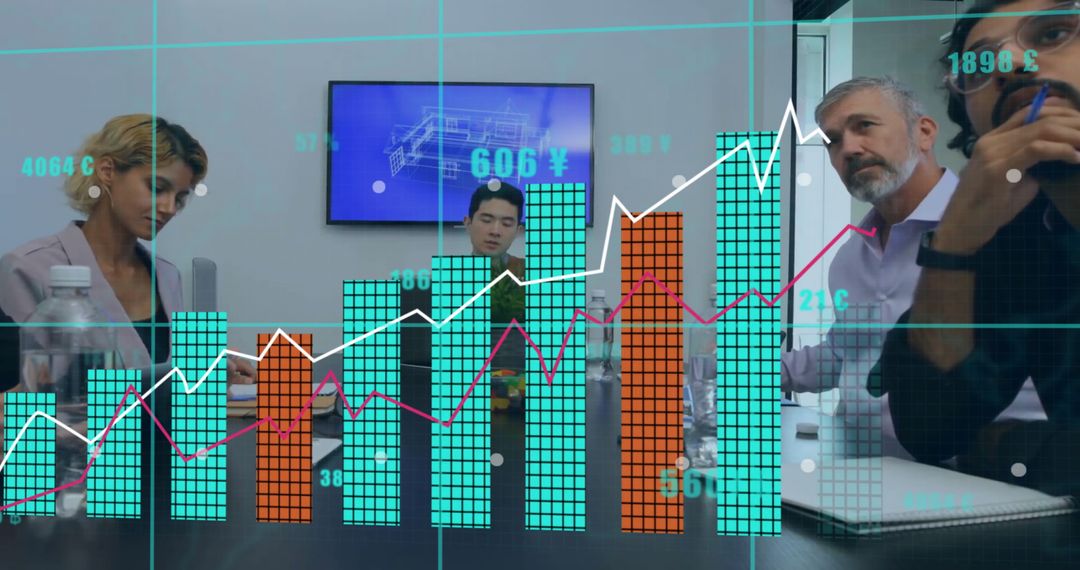
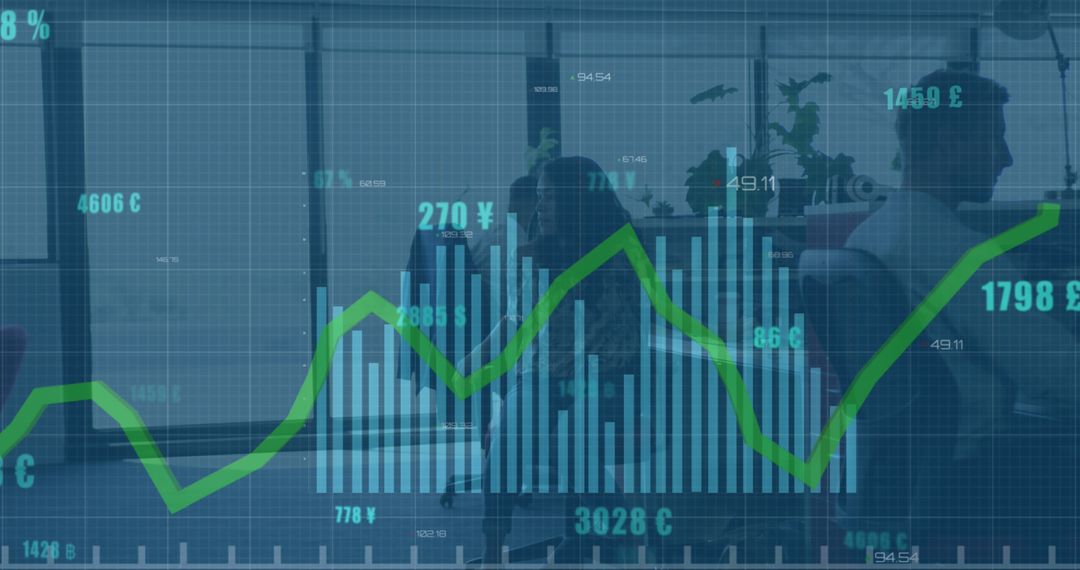
- Business team analyzing financial dashboard with teal and orange bar charts and line graphs
Business team analyzing financial dashboard with teal and orange bar charts and line graphs Image

Business team analyzing financial dashboard featuring teal and orange bar charts, stacked grid bars, and line graphs overlaid on glass display. Clean office background suggesting collaborative meeting and strategy discussion. Ideal for illustrating financial reports, market analysis, investment presentations, fintech websites, annual reports, corporate blogs, data-driven marketing materials, and investor pitch decks. Use as hero header, social media campaign, brochure cover, article illustration, slide deck background, or infographic backdrop. Cropping on right or left supporting headline or text overlay. High-contrast colors and clear data elements enabling infographic overlays, annotations, and numeric callouts.
Powered by  - Get 15% off with code: PIKWIZARD15


0
downloads
downloads
Tags:
More
Credit Photo
If you would like to credit the Photo, here are some ways you can do so
Text Link
photo Link
<span class="text-link">
<span>
<a target="_blank" href=https://pikwizard.com/photo/business-team-analyzing-financial-dashboard-with-teal-and-orange-bar-charts-and-line-graphs/51230736c4035cce494cb05df08bb91f/>PikWizard</a>
</span>
</span>
<span class="image-link">
<span
style="margin: 0 0 20px 0; display: inline-block; vertical-align: middle; width: 100%;"
>
<a
target="_blank"
href="https://pikwizard.com/photo/business-team-analyzing-financial-dashboard-with-teal-and-orange-bar-charts-and-line-graphs/51230736c4035cce494cb05df08bb91f/"
style="text-decoration: none; font-size: 10px; margin: 0;"
>
<img src="https://pikwizard.com/pw/medium/51230736c4035cce494cb05df08bb91f.jpg" style="margin: 0; width: 100%;" alt="" />
<p style="font-size: 12px; margin: 0;">PikWizard</p>
</a>
</span>
</span>
Free (free of charge)
Free for personal and commercial use.
Author: Creative Art
Similar Free Stock Images

Premium


Premium


Premium


Premium


Premium


Premium


Premium


Premium


Premium


Premium


Premium


Premium


Premium


Premium


Premium


Premium


Premium


Premium


Premium


Premium


Premium


Premium


Premium


Premium

