- Home >
- Stock Photos >
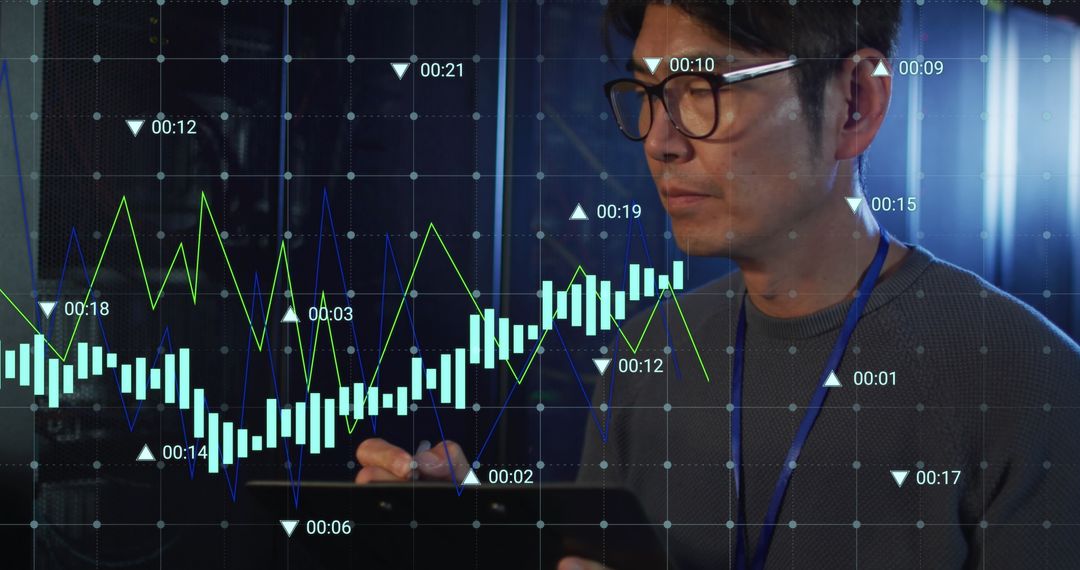
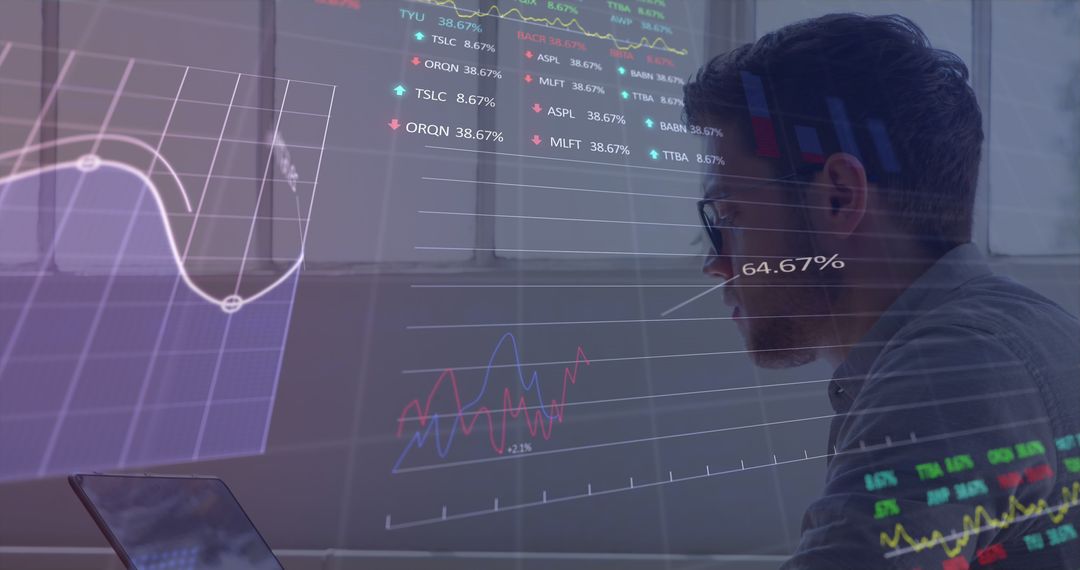
- Business Team Analyzing Financial Data and Charts in Modern Office
Business Team Analyzing Financial Data and Charts in Modern Office Image
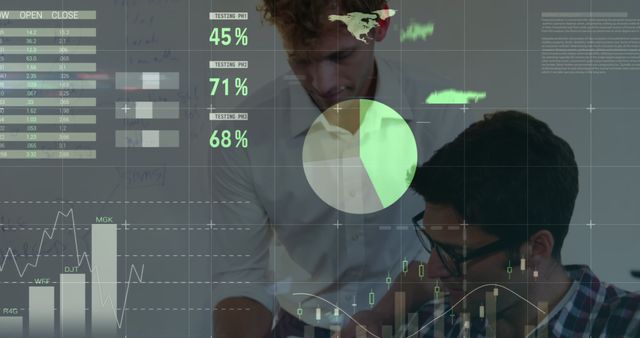
Two men in an office environment collaborate on financial data analysis, shown with varied graphs and charts overlaid digitally. The individuals appear engaged and focused, depicting a context of strategic decision making in finance or technology. This can be used in contexts such as financial consultancy, teamwork-based learning processes, or showcasing the use of technology in business operations.
Powered by  - Get 15% off with code: PIKWIZARD15


2
downloads
downloads
Tags:
More
Credit Photo
If you would like to credit the Photo, here are some ways you can do so
Text Link
photo Link
<span class="text-link">
<span>
<a target="_blank" href=https://pikwizard.com/photo/business-team-analyzing-financial-data-and-charts-in-modern-office/21f9585df72c02a10387db1a96ed3730/>PikWizard</a>
</span>
</span>
<span class="image-link">
<span
style="margin: 0 0 20px 0; display: inline-block; vertical-align: middle; width: 100%;"
>
<a
target="_blank"
href="https://pikwizard.com/photo/business-team-analyzing-financial-data-and-charts-in-modern-office/21f9585df72c02a10387db1a96ed3730/"
style="text-decoration: none; font-size: 10px; margin: 0;"
>
<img src="https://pikwizard.com/pw/medium/21f9585df72c02a10387db1a96ed3730.jpg" style="margin: 0; width: 100%;" alt="" />
<p style="font-size: 12px; margin: 0;">PikWizard</p>
</a>
</span>
</span>
Free (free of charge)
Free for personal and commercial use.
Author: Creative Art
Similar Free Stock Images

Premium


Premium


Premium


Premium


Premium


Premium


Premium


Premium


Premium


Premium


Premium


Premium


Premium


Premium


Premium


Premium


Premium


Premium


Premium


Premium


Premium


Premium


Premium


Premium